
Page 114 - Exploring the Potential of Self-Monitoring Kidney Function After Transplantation - Céline van Lint
P. 114
112
Chapter 5
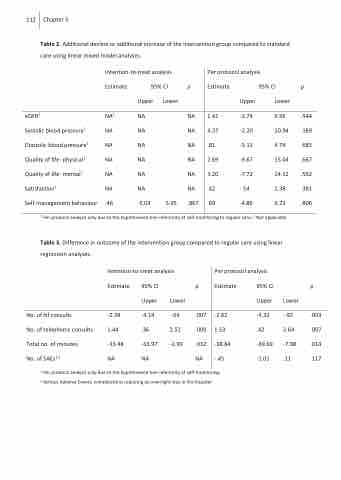
Table 2. Additional decline or additional increase of the intervention group compared to standard care using linear mixed model analyses.
Intention-to-treat analysis Estimate 95% CI
Upper Lower NA2 NA
NA NA
NA NA
NA NA
NA NA
NA NA
.46 -5.03 5.95
Per protocol analysis
eGFR1
Systolic blood pressure1 Diastolic blood pressure1 Quality of life- physical1 Quality of life- mental1 Satisfaction1 Self-management behaviour
p Estimate NA 1.41
NA 4.37 NA .81 NA 2.69 NA 3.20 NA .42 .867 .69
95% CI Upper Lower
-3.74 6.56 -2.20 10.94 -3.13 4.74 -9.67 15.04 -7.72 14.12 -.54 1.38 -4.86 6.23
p
.544 .189 .685 .667 .562 .381 .806
1 Per protocol analysis only due to the hypothesized non-inferiority of self-monitoring to regular care; 2 Not applicable
Table 3. Difference in outcome of the intervention group compared regression analyses.
to regular care using linear Per protocol analysis
Intention-to-treat analysis Estimate 95% CI
p Estimate .007 -2.62
.009 1.53 .032 -38.84 NA -.45
95% CI
Upper Lower -4.32 -.92 .42 2.64 -69.69 -7.98 -1.01 .11
p
.003 .007 .014 .117
No. of ftf consults
No. of telephonic consults Total no. of minutes
No. of SAEs1,2
Upper -2.39 -4.14
1.44 .36 -33.48 -63.97 NA NA
Lower -.64 2.52 -2.99
1 Per protocol analysis only due to the hypothesized non-inferiority of self-monitoring; 2 Serious Adverse Events, complications requiring an overnight stay in the hospital
