
Page 99 - Synthesis of Functional Nanoparticles Using an Atmospheric Pressure Microplasma Process - LiangLiang Lin
P. 99
Solvent-Free Nickel Nanoparticles Synthesis and Engineering ‒Controllable Magnetic Properties
properties, the significant agglomeration phenomenon among Ni nanoparticles makes it difficult to derive accurate particle size distributions.
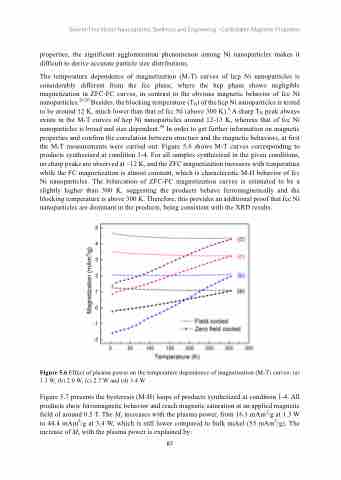
The temperature dependence of magnetization (M-T) curves of hcp Ni nanoparticles is considerably different from the fcc phase, where the hcp phase shows negligible magnetization in ZFC-FC curves, in contrast to the obvious magnetic behavior of fcc Ni nanoparticles.29,30 Besides, the blocking temperature (TB) of the hcp Ni nanoparticles is tested to be around 12 K, much lower than that of fcc Ni (above 300 K).9 A sharp TB peak always exists in the M-T curves of hcp Ni nanoparticles around 12-13 K, whereas that of fcc Ni nanoparticles is broad and size dependent.30 In order to get further information on magnetic properties and confirm the correlation between structure and the magnetic behaviors, at first the M-T measurements were carried out. Figure 5.6 shows M-T curves corresponding to products synthesized at condition 1-4. For all samples synthesized in the given conditions, no sharp peaks are observed at ~12 K, and the ZFC magnetization increases with temperature while the FC magnetization is almost constant, which is characteristic M-H behavior of fcc Ni nanoparticles. The bifurcation of ZFC-FC magnetization curves is estimated to be a slightly higher than 300 K, suggesting the products behave ferromagnetically and the blocking temperature is above 300 K. Therefore, this provides an additional proof that fcc Ni nanoparticles are dominant in the products, being consistent with the XRD results.
Figure 5.6 Effect of plasma power on the temperature dependence of magnetization (M-T) curves: (a) 1.3 W, (b) 2.0 W, (c) 2.7 W and (d) 3.4 W
Figure 5.7 presents the hysteresis (M-H) loops of products synthesized at condition 1-4. All products show ferromagnetic behavior and reach magnetic saturation at an applied magnetic field of around 0.5 T. The Ms increases with the plasma power, from 16.1 mAm2/g at 1.3 W to 44.4 mAm2/g at 3.4 W, which is still lower compared to bulk nickel (55 mAm2/g). The increase of Ms with the plasma power is explained by:
87
