
Page 75 - Synthesis of Functional Nanoparticles Using an Atmospheric Pressure Microplasma Process - LiangLiang Lin
P. 75
Titanium Nitride Nanoparticles Synthesis - an Advanced Model Study towards Nitride Nanomaterial
18
16
Pure Ar
14 12 10
8 6 4 2
Ar+N
Ar+N2+TiCl4 vapor
Ar+N2
Stop precursor
Current (mA)
Voltage (V)
Power (W)
500
450
400
350
300
250 3
200
150 2 100
50 1 0 0
2
6 5 4
Add N2
Add precursor
00 10 20 30 40 50 60
Time (min)
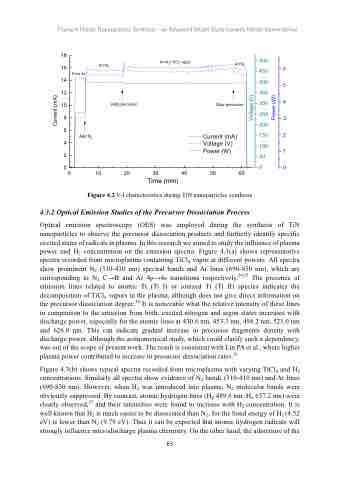
Figure 4.2 V-I characteristics during TiN nanoparticles synthesis 4.3.2 Optical Emission Studies of the Precursor Dissociation Process
Optical emission spectroscopy (OES) was employed during the synthesis of TiN nanoparticles to observe the precursor dissociation products and furtherly identify specific excited states of radicals in plasma. In this research we aimed to study the influence of plasma power and H2 concentration on the emission spectra. Figure 4.3(a) shows representative spectra recorded from microplasma containing TiCl4 vapor at different powers. All spectra show prominent N2 (310-410 nm) spectral bands and Ar lines (690-850 nm), which are corresponding to N2 C→B and Ar 4p→4s transitions respectively.24,25 The presence of emission lines related to atomic Ti (Ti I) or ionized Ti (Ti II) species indicates the decomposition of TiCl4 vapors in the plasma, although does not give direct information on the precursor dissociation degree.10 It is noticeable what the relative intensity of these lines in comparison to the emission from both: excited nitrogen and argon states increases with discharge power, especially for the atomic lines at 430.6 nm, 453.3 nm, 498.2 nm, 521.0 nm and 626.0 nm. This can indicate gradual increase in precursor fragments density with discharge power, although the actinometrical study, which could clarify such a dependency, was out of the scope of present work. The result is consistent with Lin PA et al., where higher plasma power contributed to increase in precursor dissociation rates.26
Figure 4.3(b) shows typical spectra recorded from microplasma with varying TiCl4 and H2 concentrations. Similarly all spectra show evidence of N2 bands (310-410 nm) and Ar lines (690-850 nm). However, when H2 was introduced into plasma, N2 molecular bands were obviously suppressed. By contrast, atomic hydrogen lines (Hβ 489.6 nm, Hα 657.2 nm) were clearly observed,27 and their intensities were found to increase with H2 concentration. It is well known that H2 is much easier to be dissociated than N2, for the bond energy of H2 (4.52 eV) is lower than N2 (9.79 eV). Thus it can be expected that atomic hydrogen radicals will strongly influence microdischarge plasma chemistry. On the other hand, the admixture of the
63
Current (mA)
Voltage (V)
Power (W)
