
Page 57 - Synthesis of Functional Nanoparticles Using an Atmospheric Pressure Microplasma Process - LiangLiang Lin
P. 57
Iron Oxide Nanoparticles Synthesis and Mechanism Study - a Proof-of-Concept Model Study
3.3.2 OES of Microplasma Reactor
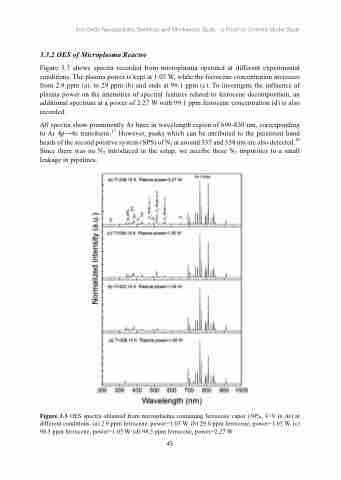
Figure 3.3 shows spectra recorded from microplasma operated at different experimental conditions. The plasma power is kept at 1.05 W, while the ferrocene concentration increases from 2.9 ppm (a), to 29 ppm (b) and ends at 99.1 ppm (c). To investigate the influence of plasma power on the intensities of spectral features related to ferrocene decomposition, an additional spectrum at a power of 2.27 W with 99.1 ppm ferrocene concentration (d) is also recorded.
All spectra show prominently Ar lines in wavelength region of 690-850 nm, corresponding to Ar 4p→4s transitions.17 However, peaks which can be attributed to the persistent band heads of the second positive system (SPS) of N2 at around 337 and 358 nm are also detected.18 Since there was no N2 introduced in the setup, we ascribe these N2 impurities to a small leakage in pipelines.
Figure 3.3 OES spectra obtained from microplasma containing ferrocene vapor (30%, V/V in Ar) at different conditions. (a) 2.9 ppm ferrocene, power=1.05 W. (b) 29.0 ppm ferrocene, power=1.05 W. (c) 98.5 ppm ferrocene, power=1.05 W. (d) 98.5 ppm ferrocene, power=2.27 W
45
