
Page 55 - Synthesis of Functional Nanoparticles Using an Atmospheric Pressure Microplasma Process - LiangLiang Lin
P. 55
Iron Oxide Nanoparticles Synthesis and Mechanism Study - a Proof-of-Concept Model Study
3.2 Experiment Section
3.2.1 Experimental
In this chapter all experiments were carried out in the microplasma setup, which can be referred to Figure 3.1. Ferrocene vapors were delivered into the plasma by means of continuous argon flow through a precursor holder (line 1). A separate argon flow (line 2) was used to control the precursor concentration. All flows were mixed before being injected into the reactor, with mass flow controllers (MFCs) used in each line to adjust gas flow rate. The volume fraction of the precursor line (line 1/total flow rate, V/V) along with variable oven temperature value was used to control precursor concentration in the gas flow through the reactor. By combining vapor pressure data (Table 1) together with Dalton’s Law and Amagat’s Law, the concentration of ferrocene could be estimated.15 During the synthesis process, the plasma power was kept in the range 1 W-2.5 W. 30 % V/V ferrocene concentration was maintained and total gas flow rate was kept constant at 100 sccm. Products were collected by directly depositing gas phase formed nanoparticles on a silicon substrate. After preset process time (mainly 2 hours), plasma was switched off. The obtained products were carefully scraped from the substrate for further characterization.
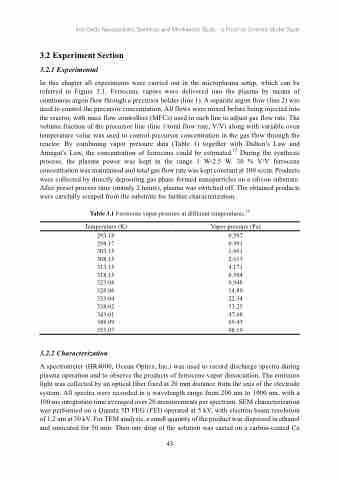
Table 3.1 Ferrocene vapor pressure at different temperatures.16
Temperature (K) 293.18 298.17 303.15 308.15 313.15 318.15 323.08 328.06 333.04 338.02 343.01 348.09 353.07
3.2.2 Characterization
Vapor pressure (Pa) 0.597
0.991
1.661
2.613
4.171
6.504
9.948
14.89
22.34
33.25
47.68
69.43
98.19
A spectrometer (HR4000, Ocean Optics, Inc.) was used to record discharge spectra during plasma operation and to observe the products of ferrocene vapor dissociation. The emission light was collected by an optical fiber fixed at 20 mm distance from the axis of the electrode system. All spectra were recorded in a wavelength range from 200 nm to 1000 nm, with a 100 ms integration time averaged over 20 measurements per spectrum. SEM characterization was performed on a Quanta 3D FEG (FEI) operated at 5 kV, with electron beam resolution of 1.2 nm at 30 kV. For TEM analysis, a small quantity of the product was dispersed in ethanol and sonicated for 50 min. Then one drop of the solution was casted on a carbon-coated Cu
43
