
Page 38 - Migraine, the heart and the brain
P. 38
Chapter 2
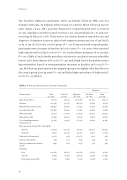
Two hundred eighty-six participants (66%) underwent follow-up MRI scan (114 migraine with aura, 89 migraine without aura, 83 controls). Mean follow-up was 8.5 years (range, 7.9-9.2; SD, 0.24 years). Reasons for nonparticipation were no interest (n = 51), inability to visit the research center (n = 30), claustrophobia (n = 8), and non- neurological illness (n = 36). There was no association between responder rate and diagnosis of migraine (response rate in both migraine groups was 203 of 296 (69%) vs 83 of 139 (60%) in the control group (P = .07). Compared with nonparticipants, participants were younger at baseline (48 vs 50 years; P = .01), more often reported high educational level (52% vs 40%; P = .01), smoked fewer packyears (8 vs 14 years; P <.001; eTable 1), had a similar prevalence of posterior circulation territory infarctlike lesions (4%), brain infarcts (6% vs 9%; P = .24), and a high load of deep white matter hyperintensities (based on semiquantitative measures at baseline; 19% vs 22%; P = .44). At follow-up, participants in the migraine group were slightly older than those in the control group (57 vs 55 years; P = .03) and had a higher prevalence of diabetes (9% vs 2%; P = .05; Table 1).
Table 1. Follow-up Characteristics of Study Participants
Migraine
Characteristic
Age, mean (SD), y
Women
Maastricht research center Low education (A)
BMI, mean (SD) Hypertension (B)
Use of antihypertensive medication (C)
Total (n = 286)
57 (7.7) 202 (71) 128 (45) 137 (48) 26 (4.1)
97 (34) 79 (28)
151 (21) 94 (11) 20 (7) 8(3) 12(4)
193 (68) 67 (35) 11 (15)
Controls (n = 83)
55 (7.3) 57 (69) 38 (46) 38 (46)
26 (3.8) 24 (29) 19 (23)
152 (19) 94 (12) 2(2) 0(0) 2(2)
58 (70) 19 (33) 12(15)
Migraine (n = 203)
57 (7.8) F 145 (71) 90 (44) 99 (49) 26 (4.3)
73 (36) 60 (30)
151 (21) 94 (11) 18 (9) G 8(4) 10(5)
135 (67) 48 (36) 11 (15)
No Aura (n = 89)
58 (7.5) 64 (72) 35 (40) 46 (52) 25 (4.3) 32 (36) 28 (32)
148 (20) 92 (10) 9(10) 2(2) 5(6)
58 (65) 22 (38) 13 (18)
Aura (n = 114)
57 (8.0) 81 (71) 55 (48) 53 (47) 26 (4.2) 41 (36) 32 (28)
154 (22) 96 (12) 9(8) 6(5) 5(4)
77 (68) 26 (34) 10 (13)
Blood pressure, mean (SD), mm Hg (B) Systolic
Diastolic
Diabetes (self-reported)
History of stroke (D)
History of transient ischemic attack
Smoking Ever
Current
Pack-years, mean (SD)
36
