
Page 30 - Functional impairment and cues for rehabilitation of head and neck cancer patients -
P. 30
Chapter 2
28
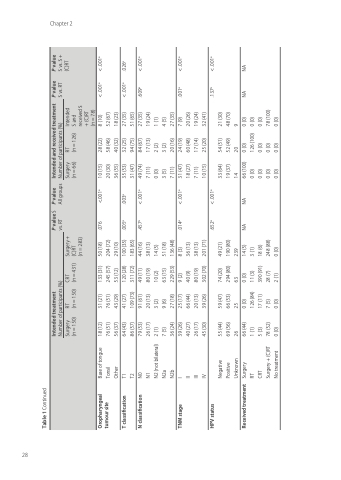
Table 1 Continued
Oropharyngeal tumour site
Base of tongue Tonsil
Other
T1
18 (12) 76 (51) 56 (37) 64 (43) 86 (57) 79 (53) 26 (17) 2 (1)
31 (21) 76 (51) 43 (29) 41 (27) 109 (73) 91 (61) 20 (13) 3 (2)
133 (31) 245 (57) 53 (12) 120 (28) 311 (72) 49 (11) 80 (19) 10 (2) 63 (15) 229 (53) 9 (2)
50 (18) 204 (72) 29 (10) 100 (35) 183 (65) 44 (16) 38 (13) 14 (5) 51 (18) 136 (48) 8 (3)
.076
<.001a
10 (15) 20 (30) 36 (55) 35 (53) 31 (47) 49 (74) 7 (11) 0 (0)
28 (22) 58 (46) 40 (32) 32 (25) 94 (75) 84 (67) 17 (13) 2 (2)
8 (10) 52 (67) 18 (23) 27 (35) 51 (65) 27 (35) 19 (24) 1 (1)
< .001a
< .001a
T classification N classification
T2
N0
N1
N2 (not bilateral) N2a
.005a .457a
.003a
< .001a
< .001a .609a
.026a
< .001a
TNM stage
N2b I
II
III IV
7 (5) 36 (24) 39 (26) 40 (27) 26 (17) 45 (30)
9 (6) 27 (18) 25 (17) 66 (44) 20 (13) 39 (26)
.014a
< .001a
3 (5)
7 (11) 31 (47) 18 (27) 7 (11) 10 (15)
3 (2) 20 (16) 24 (19) 60 (48) 17 (14) 25 (20)
4 (5) 27 (35) 7 (9) 20 (26) 19 (24) 32 (41)
.001a
< .001a
HPV status
.652a
< .001a
.137a
< .001a
Received treatment
Negative Positive Unknown Surgery RT
55 (44) 69 (56) 26
66 (44) 1 (1)
59 (47) 66 (53) 25
0 (0) 126 (84) 17 (11) 7 (5)
74 (20) 294 (80) 63
0 (0)
49 (21) 190 (80) 239
14 (5)
NA
NA
33 (64) 19 (37) 14
66 (100) 0 (0)
54 (51) 52 (49) 20
0 (0)
126 (100) 0 (0)
21 (30) 48 (70) 9
0 (0)
NA
NA
CRT
Surgery + (C)RT No treatment
5 (3) 78 (52) 0 (0)
0 (0)
11 (3) 390 (91) 28 (7)
2 (1)
3 (1)
18 (6) 248 (88) 0 (0)
0 (0) 0 (0) 0 (0)
0 (0) 0 (0)
0 (0)
0 (0)
78 (100) 0 (0)
Intended treatment
P value S vs. RT
P value All groups
Intended and received treatment
P value S vs. RT
P value S vs. S + (C)RT
Number of participants (%)
Number of participants (%)
Surgery (n = 150)
RT
(n = 150)
CRT
(n = 431)
Surgery + (C)RT
(n = 283)
Surgery (n = 66)
RT
(n = 126)
Intended S and received S + (C)RT (n = 78)
40 (9) 80 (19) 302 (70)
36 (13) 38 (13) 201 (71)
