
Page 29 - Functional impairment and cues for rehabilitation of head and neck cancer patients -
P. 29
Swallowing function after treatment for early-stage OPC
2
27
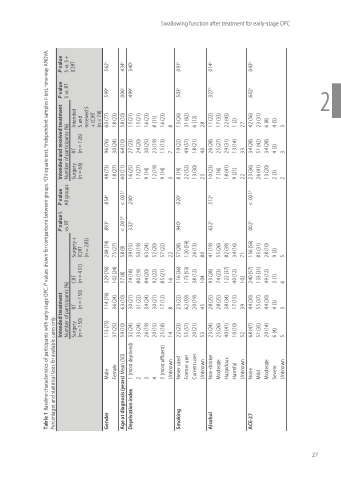
Table 1 Baseline characteristics of participants with early-stage OPC. P values shown for comparisons between groups. aChi-square test, bindependent samples t-test, cone-way ANOVA. Percentages and statistical tests for available cases only.
Gender
Age at diagnosis (years) Mean (SD)
113 (75) 37 (25) 59 (10) 32 (24) 33 (24) 26 (19) 20 (15) 25 (18) 14
114 (76) 36 (24) 63 (10) 30 (21) 31 (22) 34 (24) 30 (21) 17 (12) 8
329 (76) 102 (24) 57 (8) 74 (18) 80 (19) 84 (20) 92 (22) 85 (21) 16
208 (74) 75 (27) 58 (9) 39 (15) 50 (19) 63 (24) 52 (20) 57 (22) 22
.893a
.854a
48 (73) 18 (27) 60 (11) 16 (25) 17 (27) 9 (14) 12 (19) 9 (14) 3
96 (76) 30 (24) 64 (10) 27 (23) 24 (20) 30 (25) 23 (19) 15 (13) 7
.599a
.562a
Deprivation index
1 (most deprived) 2
3
4
< .001b .332a
< .001c .200a
.006a .499a
.434a .340a
Smoking
5 (most affluent) Unknown
Never used Former user Current user Unknown Non-drinker Moderate Hazardous Harmful Unknown
22 (23) 55 (57) 20 (21) 53
23 (22) 62 (59) 20 (19) 45
116 (36) 173 (53) 38 (12) 104
57 (28) 120 (59) 26 (13) 80
.940a
.020a
8 (19) 22 (52) 13 (30) 23
19 (22) 49 (57) 18 (21) 40
13 (26) 31 (62) 6 (12) 28
.503a
.091a
Alcohol
23 (24) 25 (26) 40 (41) 10 (10) 52
28 (25) 28 (25) 38 (34) 17 (15) 39
93 (28) 74 (23) 122 (37) 40 (12) 102 240 (57) 133 (31) 49 (12) 3 (1)
41 (19) 55 (26) 82 (39) 34 (16) 71
156 (56) 85 (31) 28 (10) 9 (3)
.632a
.512a
10 (23) 7 (16) 18 (41) 9 (21) 22
26 (28) 25 (27) 29 (31) 13 (14) 33
11 (22) 17 (33) 22 (43) 1 (2) 27
.327 a
.014a
ACE-27
None Mild Moderate Severe Unknown
68 (47) 51 (35) 20 (14) 6 (4)
44 (30) 55 (37) 44 (30) 4 (3)
.002a
< .001a
23 (36) 26 (41) 13 (20) 2 (3)
34 (28) 51 (42) 34 (28) 4 (3)
42 (56) 23 (31) 6 (8)
4 (5)
.602a
.043a
Male Female
18 (23) 58 (10) 15 (21) 15 (21) 16 (23) 8 (11) 16 (23) 8
Intended treatment
P value S vs. RT
P value All groups
Intended and received treatment
P value S vs. RT
P value S vs. S + (C)RT
Number of participants (%)
Number of participants (%)
Surgery (n = 150)
RT
(n = 150)
CRT
(n = 431)
Surgery + (C)RT
(n = 283)
Surgery (n = 66)
RT
(n = 126)
Intended S and received S + (C)RT (n = 78) 60 (77)
5
3
6
5
2
3
3
