
Page 195 - Functional impairment and cues for rehabilitation of head and neck cancer patients -
P. 195
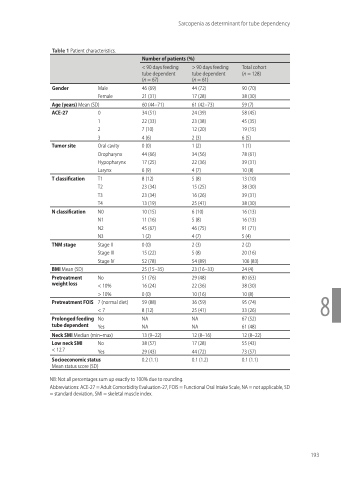
Table 1 Patient characteristics.
Gender Male Female
Age (years) Mean (SD)
46 (69) 21 (31)
60 (44–71)
34 (51) 22 (33) 7 (10) 4 (6)
0 (0) 44 (66) 17 (25) 6 (9)
8 (12) 23 (34) 23 (34) 13 (19)
10 (15) 11 (16) 45 (67) 1 (2)
0 (0) 15 (22) 52 (78)
25 (15–35)
51 (76) 16 (24) 0 (0)
59 (88) 8 (12)
NA NA
13 (9–22)
38 (57) 29 (43)
0.2 (1.1)
44 (72) 17 (28)
61 (42–73)
24 (39) 23 (38) 12 (20) 2 (3)
1 (2) 34 (56) 22 (36) 4 (7)
5 (8) 15 (25) 16 (26) 25 (41)
6 (10) 5 (8) 46 (75) 4 (7)
2 (3)
5 (8) 54 (89)
23 (16–33)
29 (48) 22 (36) 10 (16)
36 (59) 25 (41)
NA NA
12 (8–16)
17 (28) 44 (72)
0.1 (1.2)
90 (70) 38 (30)
59 (7)
58 (45) 45 (35) 19 (15) 6 (5)
1 (1) 78 (61) 39 (31) 10 (8)
13 (10) 38 (30) 39 (31) 38 (30)
16 (13) 16 (13) 91 (71) 5 (4)
2 (2)
20 (16) 106 (83)
24 (4)
80 (63) 38 (30) 10 (8)
95 (74) 33 (26)
67 (52) 61 (48)
12 (8–22)
55 (43) 73 (57)
0.1 (1.1)
ACE-27
Tumor site
T classification
N classification
TNM stage
BMI Mean (SD)
Pretreatment weight loss
Pretreatment FOIS
Prolonged feeding tube dependent
0 1 2 3
Oral cavity Oropharynx Hypopharynx Larynx
T1 T2 T3 T4
N0 N1 N2 N3
Stage II Stage III Stage IV
No
< 10% > 10%
7 (normal diet) <7
No Yes
8
Sarcopenia as determinant for tube dependency
   Number of patients (%)
   < 90 days feeding tube dependent (n = 67)
 > 90 days feeding tube dependent (n = 61)
 Total cohort (n = 128)
             Neck SMI Median (min–max)
Low neck SMI No
 < 12.7
Yes
 Socioeconomic status
Mean status score (SD)
 NB: Not all percentages sum up exactly to 100% due to rounding.
Abbreviations: ACE-27 = Adult Comorbidity Evaluation-27, FOIS = Functional Oral Intake Scale, NA = not applicable, SD = standard deviation, SMI = skeletal muscle index.
193
