
Page 134 - Functional impairment and cues for rehabilitation of head and neck cancer patients -
P. 134
Chapter 5
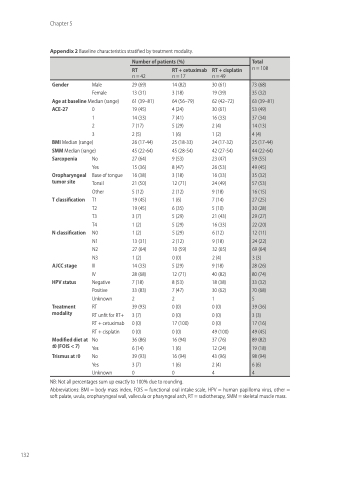
Appendix 2 Baseline characteristics stratified by treatment modality.
Number of patients (%)
Total
n = 108
RT
n = 42
RT + cetuximab
n = 17
RT + cisplatin
n = 49
132
Gender Male Female
Age at baseline Median (range) ACE-27 0
1 2 3
BMI Median (range) SMM Median (range)
29 (69)
13 (31)
61 (39–81) 19 (45)
14 (33)
7 (17)
2 (5)
26 (17-44) 45 (22-64) 27 (64)
15 (36)
16 (38)
21 (50)
5 (12)
19 (45)
19 (45)
3 (7)
1 (2)
1 (2)
13 (31)
27 (64)
1 (2)
14 (33)
28 (68)
7 (18)
33 (83)
2
39 (93)
3 (7)
0 (0)
0 (0)
36 (86)
6 (14)
39 (93)
3 (7)
0
14 (82)
3 (18)
64 (56–79) 4 (24)
7 (41)
5 (29)
1 (6)
25 (18-33) 45 (28-54) 9 (53)
8 (47)
3 (18)
12 (71)
2 (12)
1 (6)
6 (35)
5 (29)
5 (29)
5 (29)
2 (12)
10 (59)
0 (0)
5 (29)
12 (71)
8 (53)
7 (47)
2
0 (0)
0 (0)
17 (100)
0 (0)
16 (94)
1 (6)
16 (94)
1 (6)
0
30 (61)
19 (39)
62 (42–72) 30 (61)
16 (33)
2 (4)
1 (2)
24 (17-32) 42 (27-54) 23 (47)
26 (53)
16 (33)
24 (49)
9 (18)
7 (14)
5 (10)
21 (43)
16 (33)
6 (12)
9 (18)
32 (65)
2 (4)
9 (18)
40 (82)
18 (38)
30 (62)
1
0 (0)
0 (0)
0 (0)
49 (100) 37 (76)
12 (24)
43 (96)
2 (4)
4
73 (68)
35 (32)
63 (39–81) 53 (49)
37 (34)
14 (13)
4 (4)
25 (17-44) 44 (22-64) 59 (55)
49 (45)
35 (32)
57 (53)
16 (15)
27 (25)
30 (28)
29 (27)
22 (20)
12 (11)
24 (22)
69 (64)
3 (3)
28 (26)
80 (74)
33 (32)
70 (68)
5
39 (36)
3 (3)
17 (16)
49 (45)
89 (82)
19 (18)
98 (94)
6 (6)
4
Sarcopenia
Oropharyngeal tumor site
T classification
N classification
AJCC stage HPV status
Treatment modality
Modified diet at t0 (FOIS < 7)
Trismus at t0
No
Yes
Base of tongue Tonsil
Other
T1
T2
T3
T4
N0
N1
N2
N3
III
IV
Negative Positive Unknown
RT
RT unfit for RT+ RT + cetuximab RT + cisplatin No
Yes
No
Yes
Unknown
NB: Not all percentages sum up exactly to 100% due to rounding.
Abbreviations: BMI = body mass index, FOIS = functional oral intake scale, HPV = human papilloma virus, other = soft palate, uvula, oropharyngeal wall, vallecula or pharyngeal arch, RT = radiotherapy, SMM = skeletal muscle mass.
