
Page 133 - Functional impairment and cues for rehabilitation of head and neck cancer patients -
P. 133
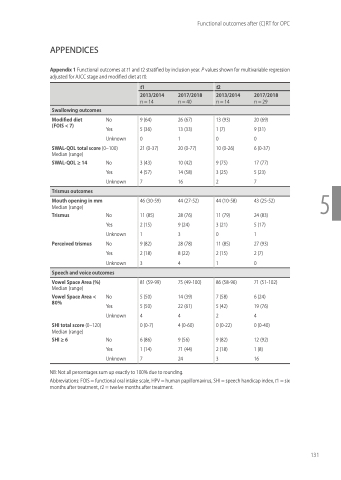
APPENDICES
Appendix 1 Functional outcomes at t1 and t2 stratified by inclusion year. P values shown for multivariable regression adjusted for AJCC stage and modified diet at t0.
Median (range)
SWAL-QOL ≥ 14
Mouth opening in mm
Median (range)
Trismus
Perceived trismus
Vowel Space Area (%)
Median (range)
Vowel Space Area < 80%
SHI total score (0–120) Median (range)
SHI ≥ 6
No
Yes Unknown
No
Yes Unknown No
Yes Unknown
No
Yes Unknown
No
Yes Unknown
5
Yes Unknown
Functional outcomes after (C)RT for OPC
       Swallowing outcomes
t1
9 (64) 26 (67) 5 (36) 13 (33) 01
21 (0-37)
3 (43)
4 (57)
7 16
2017/2018
n = 40
t2
      2013/2014
n = 14
2013/2014
n = 14
2017/2018
n = 29
          20 (0-77)
10 (42) 14 (58)
   Trismus outcomes
     46 (30-59)
11 (85)
2 (15) 13
9 (82) 28 (78) 2 (18) 8 (22) 34
44 (27-52)
28 (76) 9 (24)
   Speech and voice outcomes
     81 (59-99)
5 (50)
5 (50) 44
0 (0-7)
6 (86)
1 (14)
7 24
75 (49-100)
14 (39) 22 (61)
4 (0-60)
9 (56) 71 (44)
   Modified diet No
13 (93)
1 (7)
0
10 (0-26)
9 (75) 3 (25) 2
44 (10-58)
11 (79) 3 (21) 0
11 (85) 2 (15) 1
86 (58-96)
7 (58)
5 (42)
2
0 (0-22)
9 (82) 2 (18) 3
20 (69) 9 (31)
0
6 (0-37)
17 (77) 5 (23) 7
43 (25-52)
24 (83) 5 (17) 1
27 (93) 2 (7)
0
71 (51-102)
6 (24) 19 (76) 4
0 (0-40)
12 (92) 1 (8) 16
(FOIS < 7)
SWAL-QOL total score (0–100)
  NB: Not all percentages sum up exactly to 100% due to rounding.
Abbreviations: FOIS = functional oral intake scale, HPV = human papillomavirus, SHI = speech handicap index, t1 = six months after treatment, t2 = twelve months after treatment.
131
