
Page 111 - 89Zr-Immuno-PET:Towards a Clinical Tool to Guide Antibody-based Therapy in Cancer
P. 111
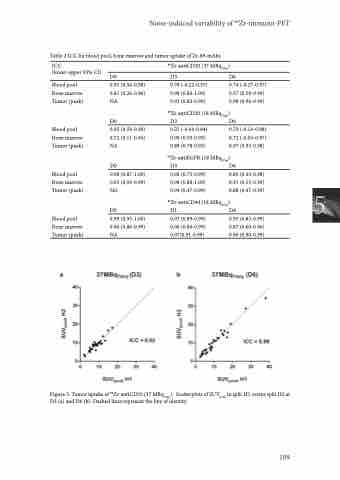
                                Table 2 ICC for blood pool, bone marrow and tumor uptake of Zr-89-mAbs
Noise-induced variability of 89Zr-immuno-PET
 ICC
(lower-upper 95% CI)
Blood pool Bone marrow Tumor (peak)
Blood pool Bone marrow Tumor (peak)
Blood pool Bone marrow Tumor (peak)
Blood pool Bone marrow Tumor (peak)
D0
0.91 (0.56-0.98) 0.81 (0.26-0.96) NA
D0
0.92 (0.59-0.99) 0.72 (0.11-0.94) NA
D0
0.98 (0.87-1.00) 0.93 (0.59-0.99) NA
D0
0.99 (0.95-1.00) 0.96 (0.86-0.99) NA
89Zr-antiCD20 (37 MBq74inj)
D3 D6
  0.78 (-0.22-0.97) 0.98 (0.86-1.00) 0.92 (0.83-0.96)
0.74 (-0.27-0.97) 0.97 (0.59-0.99) 0.98 (0.96-0.99)
89Zr-antiCD20 (18 MBq74inj) D3 D6
 0.25 (-0.60-0.84) 0.90 (0.50-0.99) 0.89 (0.78-0.95)
89Zr-antiEGFR (18 MBq37inj)
D3 D6
0.96 (0.75-0.99) 0.89 (0.43-0.98)
0.98 (0.88-1.00) 0.91 (0.55-0.99)
0.94 (0.47-0.99) 0.88 (0.47-0.99) 5
0.79 (-0.19-0.98) 0.72 (-0.05-0.97) 0.97 (0.93-0.98)
   89Zr-antiCD44 (18 MBq37inj) D1 D4
 0.97 (0.89-0.99) 0.96 (0.86-0.99) 0.97(0.91-0.99)
0.95 (0.83-0.99) 0.87 (0.60-0.96) 0.96 (0.90-0.99)
  Figure 5. Tumor uptake of 89Zr-antiCD20 (37 MBq74inj). Scatterplots of SUVpeak in split H1 versus split H2 at D3 (a) and D6 (b). Dashed lines represent the line of identity.
109
