
Page 108 - 89Zr-Immuno-PET:Towards a Clinical Tool to Guide Antibody-based Therapy in Cancer
P. 108
Chapter 5
from 32%, 18% to 4% was observed, with a corresponding increase in volume from 2.9 mL (blood pool), 8.6 mL (bone marrow) to 309 mL (kidney).
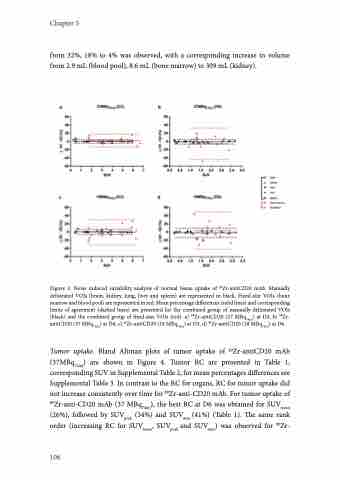
Figure 2. Noise induced variability analysis of normal tissue uptake of 89Zr-antiCD20 mAb. Manually delineated VOIs (brain, kidney, lung, liver and spleen) are represented in black. Fixed-size VOIs (bone marrow and blood pool) are represented in red. Mean percentage differences (solid lines) and corresponding limits of agreement (dashed lines) are presented for the combined group of manually delineated VOIs (black) and the combined group of fixed-size VOIs (red). a) 89Zr-antiCD20 (37 MBq74inj) at D3, b) 89Zr- antiCD20 (37 MBq74inj) at D6, c) 89Zr-antiCD20 (18 MBq74inj) at D3, d) 89Zr-antiCD20 (18 MBq74inj) at D6.
Tumor uptake. Bland Altman plots of tumor uptake of 89Zr-antiCD20 mAb (37MBq74inj) are shown in Figure 4. Tumor RC are presented in Table 1, corresponding SUV in Supplemental Table 2, for mean percentages differences see Supplemental Table 3. In contrast to the RC for organs, RC for tumor uptake did not increase consistently over time for 89Zr-anti-CD20 mAb. For tumor uptake of 89Zr-anti-CD20 mAb (37 MBq74inj), the best RC at D6 was obtained for SUVmean (26%), followed by SUVpeak (34%) and SUVmax (41%) (Table 1). The same rank order (increasing RC for SUVmean, SUVpeak and SUVmax) was observed for 89Zr-
106
