
Page 38 - Advanced concepts in orbital wall fractures
P. 38
Chapter 2
Table 1 Results of the three (semi-)automatic methods compared to the gold standard.
Method A Method SA Method SAA
Average SD difference (cc) (cc)
0.49 0.74 0.24 0.27 0.86 0.27
Intraobserver Interobserver (ICC) (ICC)
– –
– – 0.998 0.990
Average SD time (s) (s)
38 5.4 146 16.0 327 36.2
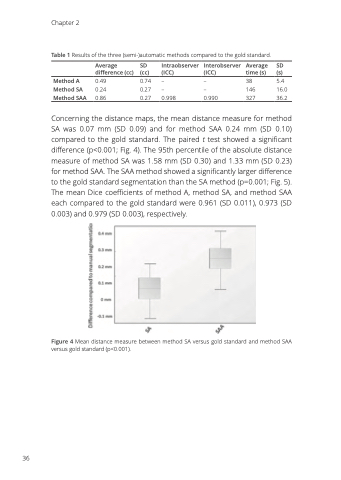
Concerning the distance maps, the mean distance measure for method SA was 0.07 mm (SD 0.09) and for method SAA 0.24 mm (SD 0.10) compared to the gold standard. The paired t test showed a significant difference (p<0.001; Fig. 4). The 95th percentile of the absolute distance measure of method SA was 1.58 mm (SD 0.30) and 1.33 mm (SD 0.23) for method SAA. The SAA method showed a significantly larger difference to the gold standard segmentation than the SA method (p=0.001; Fig. 5). The mean Dice coefficients of method A, method SA, and method SAA each compared to the gold standard were 0.961 (SD 0.011), 0.973 (SD 0.003) and 0.979 (SD 0.003), respectively.
Figure 4 Mean distance measure between method SA versus gold standard and method SAA versus gold standard (p<0.001).
36
