
Page 108 - Second language development of newly arrived migrant kindergarteners - Frederike Groothoff
P. 108
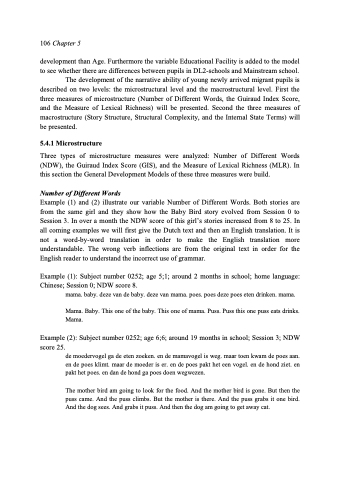
108 Chapter 5 55 50 45 40 35 30 25 20 Growth NDW-score 80% within - 80% within + 80% between - 80% between + Age in Months Figure 5.4: Graphical Representation of the General Development Model of NDW with 80% Reliability. Figure 5.4 shows that of the effect of Age on the NDW is significant. The differences within individuals (represented by the striped lines in Figure 5.4) and between individuals (represented by the dotted lines in Figure 5.4) did not depend on Age. The variance within and between pupils is large and constant which means that over time there are equal large differences in scores within participants and between participants. Exposure to Dutch at School, measured as the number of months a pupil has attended a Dutch school (excluding summer months), was added to the General Development Model of the NDW. A likelihood ratio test showed that the main effect of Exposure to Dutch at School contributed significantly to the fit of the model to the observed data (ΔΧ2 (NDW5) = 5.73; df = 1; p =.02; see Table 5.9): the longer the Exposure of Dutch at School was, the higher the score of the NDW. No interaction between Age and Exposure to Dutch at School was found (NDW6). 51 55 59 63 67 71 75 79 83 87 91 95 99 103 Number of Different Words NDW Score
