
Page 90 - Bladder Dysfunction in the Context of the Bladder-Brain Connection - Ilse Groenendijk.pdf
P. 90
88
Chapter 4
a closer examination, this area corresponds to the pMCG and not S1, which had been suggested previously.4
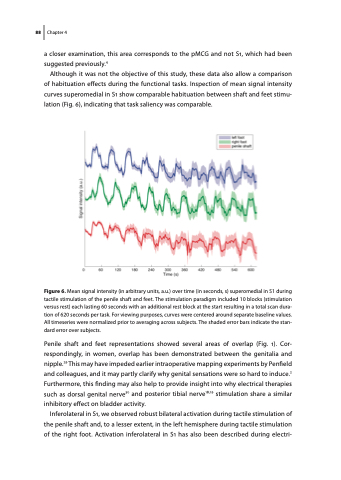
Although it was not the objective of this study, these data also allow a comparison of habituation effects during the functional tasks. Inspection of mean signal intensity curves superomedial in S1 show comparable habituation between shaft and feet stimu- lation (Fig. 6), indicating that task saliency was comparable.
Figure 6. Mean signal intensity (in arbitrary units, a.u.) over time (in seconds, s) superomedial in S1 during tactile stimulation of the penile shaft and feet. The stimulation paradigm included 10 blocks (stimulation versus rest) each lasting 60 seconds with an additional rest block at the start resulting in a total scan dura- tion of 620 seconds per task. For viewing purposes, curves were centered around separate baseline values. All timeseries were normalized prior to averaging across subjects. The shaded error bars indicate the stan- dard error over subjects.
Penile shaft and feet representations showed several areas of overlap (Fig. 1). Cor- respondingly, in women, overlap has been demonstrated between the genitalia and nipple.29 This may have impeded earlier intraoperative mapping experiments by Penfield and colleagues, and it may partly clarify why genital sensations were so hard to induce.2 Furthermore, this finding may also help to provide insight into why electrical therapies such as dorsal genital nerve30 and posterior tibial nerve18,19 stimulation share a similar inhibitory effect on bladder activity.
Inferolateral in S1, we observed robust bilateral activation during tactile stimulation of the penile shaft and, to a lesser extent, in the left hemisphere during tactile stimulation of the right foot. Activation inferolateral in S1 has also been described during electri-
