
Page 80 - Demo
P. 80
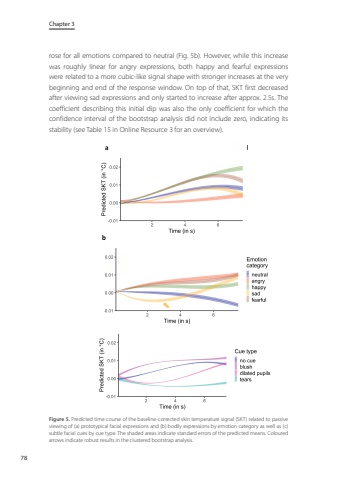
Chapter 378rose for all emotions compared to neutral (Fig. 5b). However, while this increase was roughly linear for angry expressions, both happy and fearful expressions were related to a more cubic-like signal shape with stronger increases at the very beginning and end of the response window. On top of that, SKT first decreased after viewing sad expressions and only started to increase after approx. 2.5s. The coefficient describing this initial dip was also the only coefficient for which the confidence interval of the bootstrap analysis did not include zero, indicating its stability (see Table 15 in Online Resource 3 for an overview).Figure 5. Predicted time course of the baseline-corrected skin temperature signal (SKT) related to passive viewing of (a) prototypical facial expressions and (b) bodily expressions by emotion category as well as (c) subtle facial cues by cue type. The shaded areas indicate standard errors of the predicted means. Coloured arrows indicate robust results in the clustered bootstrap analysis.
