
Page 33 - Biomarkers for risk stratification and guidance in heart failure
P. 33
Chapter 2
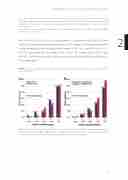
Figure 2: Kaplan-Meier curve for all-cause mortality by (A) number of elevated biomarkers and (B) MARKED- risk score categories.
Multi marker Emergency Dyspnea risk score.
Resulting from the final prognostic model for 90-day mortality, a risk score was established. Simplifying the risk score by giving each factor the same weight (1 point) and by excluding the weakest factor (i.e. gender) did not change performance of the score. Excluding any of the other variables did reduce the AUC by ≥1%. Final variables in the Multi mARKer Emergency Dyspnea-score (MARKED- risk score) therefore consisted of: age ≥75, history of HF, dypnea at rest, systolic blood pressure <110 mmHg, hs-CRP ≥25 mg/L, hs-cTNT ≥0.04 μg/L, and Cys-C ≥1.125 mg/L. The score showed excellent discrimination (AUC 0.85, 95% CI 0.81- 0.89) and predicted mortality risk closely resembled observed mortality risk (appendix 3). Internal validation by means of cross-validation (mean AUC 0.85, 95% CI 0.81-0.89) and bootstrapping (AUC 0.85, 95% CI 0.81-0.89) showed that the score’s performance was robust. Ninety-day mortality rates gradually increased per MARKED-score point (figure 3).
The score was categorized into low (0-2 points), intermediate (3-4 points) and high risk categories (≥5 points). Figure 2B shows the Kaplan-Meier curve for all-
32
