
Page 111 - Biomarkers for risk stratification and guidance in heart failure
P. 111
Chapter 5
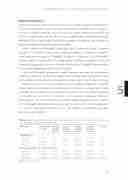
Table 3. Univariate and Adjusted Multivariate Hazard Ratios for Predictors of Mortality and for the Composite End Point of HF Readmission or Mortality
Univariate Analysis
Adjusted Multivariate Analysis*
Mortality
NT-proBNP at admission above versus below the median
Inpatient decrease NT- proBNP below vs above the median
NT-proBNP at discharge above vs below the median
Early outpatient increase vs decrease in NT-proBNP
NT-proBNP at 1 month above vs below the median
HR
1.33 3.07 2.52 4.94 2.61
95% Cl
0.86-2.05 1.90-4.98 1.58-4.00 2.90-8.43 1.62-4.19
0.87-1.73 1.64-3.36 1.21-2.43 2.25-4.86 2.34-4.98
Wald P Value HR
1.7 .197
20.9 <.001 1.72 15.2 <.001
34.4 <.001 1.88 15.6 <.001 2.09
1.4 .242
21.6 <.001 1.71
9.2 .002
37.1 <.001 2.71 40.3 <.001 1.81
95% Cl
1.01-2.91
1.12-3.16 1.10-3.97
1.13-2.60
1.76-4.17 1.13-2.89
Wald P Value
4.0 .045
5.6 .018 5.1 .024
6.4 .011
20.5 <.001 6.1 .014
HF readmission or mortality
NT-proBNP at admission above versus below the median
Inpatient decrease NT- proBNP below vs above the median
NT-proBNP at discharge above vs below the median
Early outpatient increase vs decrease in NT-proBNP
NT-proBNP at 1 month above vs below the median
1.23 2.34 1.71 3.31 3.41
HR, hazard ratio; CI, confidence the total follow-up period. *Adjusted for clinical parameters.
110
interval; other abbreviations as in Table 1. Hazard ratios calculated within
