
Page 85 - Peri-implant health: the effect of implant design and surgical procedure on bone and soft tissue stability
P. 85
LONG-TERM EFFECT OF SURFACE ROUGHNESS AND PATIENTS' FACTORS ON CRESTAL BONE LOSS AT DENTAL IMPLANTS. A SYSTEMATIC REVIEW AND META-ANALYSIS
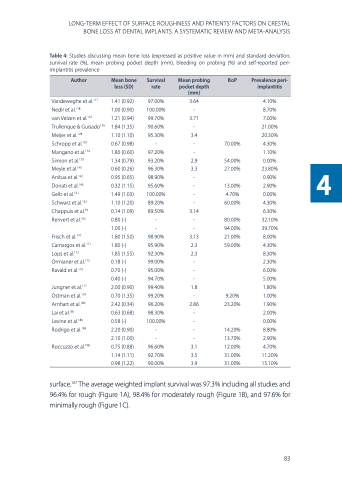
Table 4: Studies discussing mean bone loss (expressed as positive value in mm) and standard deviation, survival rate (%), mean probing pocket depth (mm), bleeding on probing (%) and self-reported peri- implantitis prevalence
Author
Mean bone loss (SD)
Survival rate
Mean probing pocket depth (mm)
BoP
Prevalence peri- implantitis
Vandeweghe et al.117 Nedir et al.118
van Velzen et al.125 Trullenque & Guisado126 Meijer et al.128
Schropp et al.130 Mangano et al.134 Simion et al.135 Meyle et al.140 Anitua et al.142 Donati et al.146 Gelb et al.151 Schwarz et al.152 Chappuis et al.39 Renvert et al.163
Frisch et al.170 Camargos et al.171 Lops et al.172 Ormianer et al.173 Ravald et al.175
Jungner et al.177 Ostman et al.179 Arnhart et al.180 Lai et al.181 Levine et al.184 Rodrigo et al.185
Roccuzzo et al.198
1.41 (0.92) 1.00 (0.90) 1.21 (0.94) 1.84 (1.35) 1.10 (1.10) 0.67 (0.98) 1.80 (0.60) 1.34 (0.79) 0.60 (0.26) 0.95 (0.65) 0.32 (1.15) 1.49 (1.03) 1.10 (1.20) 0.14 (1.09) 0.80 (-) 1.00 (-) 1.80 (1.50) 1.80 (-) 1.85 (1.55) 0.18 (-) 0.70 (-) 0.40 (-) 2.00 (0.90) 0.70 (1.35) 2.42 (0.34) 0.63 (0.68) 0.58 (-) 2.20 (0.90) 2.10 (1.00) 0.75 (0.88) 1.14 (1.11) 0.98 (1.22)
97.00% 3.64 100.00% -
99.70% 3.71 90.60% - 95.30% 3.4
- - 70.00% 97.20% -
93.20% 2.9 54.00% 96.30% 3.3 27.00% 98.90% -
95.60% - 13.00% 100.00% - 4.70% 89.20% - 60.00%
89.50% 3.14
- - 80.00% - - 94.00%
98.90% 3.13 21.00% 95.90% 2.3 59.00% 92.30% 2.3
99.00% -
95.00% -
94.70% -
99.40% 1.8
99.20% - 9.20% 96.20% 2.86 23.20% 98.30% -
100.00% -
-- 14.20% -- 13.70%
96.60% 3.1 12.00% 92.70% 3.5 31.00% 90.00% 3.9 31.00%
4.10% 8.70% 7.00% 21.00% 20.30% 4.30% 1.10% 0.00% 23.80% 0.90% 2.90% 0.00% 4.30% 6.30% 32.10% 39.70% 8.00% 4.30% 8.30% 2.30% 6.00% 5.00% 1.80% 1.00% 1.90% 2.00% 0.00% 8.80% 2.90% 4.70% 11.20% 15.10%
surface.167 The average weighted implant survival was 97.3% including all studies and 96.4% for rough (Figure 1A), 98.4% for moderately rough (Figure 1B), and 97.6% for minimally rough (Figure 1C).
83
4
