
Page 175 - Peri-implant health: the effect of implant design and surgical procedure on bone and soft tissue stability
P. 175
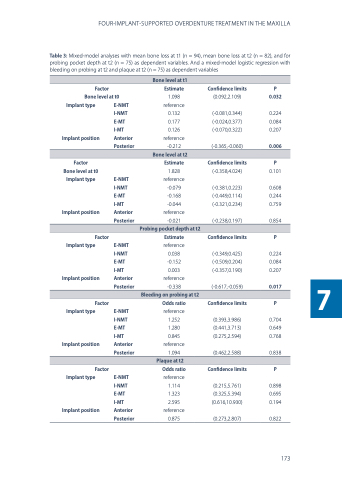
                                FOUR-IMPLANT-SUPPORTED OVERDENTURE TREATMENT IN THE MAXILLA
Table 3: Mixed-model analyses with mean bone loss at t1 (n = 94), mean bone loss at t2 (n = 82), and for probing pocket depth at t2 (n = 75) as dependent variables. And a mixed-model logistic regression with bleeding on probing at t2 and plaque at t2 (n = 75) as dependent variables
  Bone level at t1
Factor Estimate Bone level at t0 1.098
Confidence limits
(0.092,2.109)
(-0.081,0.344) (-0.024,0.377) (-0.070,0.322)
(-0.365,-0.060)
Confidence limits
(-0.358,4.024)
(-0.381,0.223) (-0.449,0.114) (-0.321,0.234)
(-0.238,0.197)
Confidence limits
(-0.349,0.425) (-0.509,0.204) (-0.357,0.190)
(-0.617,-0.059)
Confidence limits
(0.393,3.986) (0.441,3.713) (0.275,2.594)
(0.462,2.588)
Confidence limits
(0.215,5.761)
(0.325,5.394) (0.616,10.930)
(0.273,2.807)
P 0.032
0.224 0.084 0.207
0.006
P
0.101
0.608 0.244 0.759
0.854
P
0.224 0.084 0.207
0.017
P
0.704 0.649 0.768
0.838
P
0.898 0.695 0.194
0.822
 Implant type
Implant position
Factor Bone level at t0 Implant type
Implant position
Factor Implant type
Implant position
Factor Implant type
Implant position
Factor Implant type
Implant position
E-NMT reference I-NMT 0.132 E-MT 0.177 I-MT 0.126 Anterior reference
Posterior
E-NMT I-NMT E-MT I-MT Anterior Posterior
E-NMT I-NMT E-MT I-MT Anterior Posterior
E-NMT I-NMT E-MT I-MT Anterior Posterior
E-NMT I-NMT E-MT I-MT Anterior Posterior
-0.212
Bone level at t2
Estimate
1.828 reference -0.079 -0.168 -0.044 reference -0.021
Probing pocket depth at t2
Estimate
reference 0.038 -0.152 0.003 reference -0.338
Bleeding on probing at t2
Odds ratio
reference 1.252 1.280 0.845 reference 1.094
Plaque at t2
Odds ratio
reference 1.114 1.323 2.595 reference 0.875
         173
 7
