
Page 173 - Peri-implant health: the effect of implant design and surgical procedure on bone and soft tissue stability
P. 173
FOUR-IMPLANT-SUPPORTED OVERDENTURE TREATMENT IN THE MAXILLA
171
7
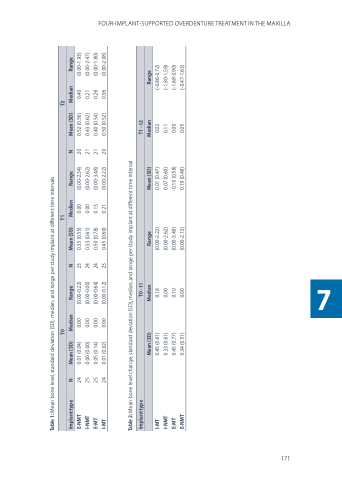
Table 1: Mean bone level, standard deviation (SD), median, and range per study implant at different time intervals
T0 T1 T2
Implant type N E-NMT 24 I-NMT 25 E-MT 25 I-MT 24
Mean (SD)
Median Range N
Mean (SD) Median Range N
Mean (SD)
Median
Range
0.01 (0.04) 0.00 0.00 (0.00) 0.00 0.05 (0.14) 0.00 0.01 (0.02) 0.00
(0.00-0.22) (0.00-0.00) (0.00-0.64) (0.00-0.12)
23 24 24 23
0.35 (0.55) 0.00 0.33 (0.61) 0.00 0.50 (0.78) 0.13 0.45 (0.60) 0.21
(0.00-2.34) 20 (0.00-2.62) 21 (0.00-3.48) 21 (0.00-2.22) 20
0.52 (0.56) 0.43 (0.62) 0.40 (0.54) 0.50 (0.52)
0.40 0.21 0.26 0.36
(0.00-1.93) (0.00-2.47) (0.00-1.80) (0.00-2.08)
Table 2: Mean bone level change, standard deviation (SD), median,
and range per study implant at different time interval
Implant type
T0 - t1 Median
T1 - t2 Median 0.02 0.11 0.00 0.05
I-MT I-NMT E-MT E-NMT
0.45 (0.61) 0.33 (0.61) 0.45 (0.77) 0.34 (0.51)
0.18 (0.00-2.22) 0.00 (0.00-2.62) 0.10 (0.00-3.48) 0.00 (0.00-2.13)
0.01 (0.47) 0.07 (0.60) -0.10 (0.58) 0.19 (0.48)
(-0.86-0.72) (-1.80-1.59) (-1.68-0.90) (-0.47-1.63)
Mean (SD)
Range
Mean (SD)
Range
