
Page 129 - Peri-implant health: the effect of implant design and surgical procedure on bone and soft tissue stability
P. 129
IMPROVEMENT OF QUALITY OF LIFE WITH IMPLANT-SUPPORTED MANDIBULAR OVERDENTURES AND THE EFFECT OF IMPLANT TYPE AND SURGICAL PROCEDURE ON BONE AND SOFT TISSUE STABILITY
Table 4: Mean probing pocket depth on implant level at 6, 12, 24 and 36 months for each study group and the mean difference between respectively equicrestally versus subcrestally placed implants and implants with a moderately rough versus minimally rough neck.
Probing pocket depth
Group 1: Equicrestal
Group 2: Subcrestal
Paired difference
Mean (SD)
Min
Max
Mean (SD)
Min
Max
Mean dif
95% CI
P
6 months 12 months 24 months 36 months
6 months 12 months 24 months 36 months
1.88 (0.53) 1.70 (0.44) 2.30 (0.66) 2.42 (0.69)
2.93 (0.71) 2.65 (0.72) 2.48 (0.58) 2.10 (0.68)
1.00 3.25 1.00 2.50 1.50 4.50 1.00 4.00
1.75 5.25 1.75 4.75 1.25 3.50 1.25 4.25
2.01 (0.66) 1.00 3.75 -0.135 1.83 (0.53) 1.00 2.75 -0.130 2.57 (0.84) 1.25 4.50 -0.261 2.59 (0.71) 1.00 3.75 -0.163
2.88 (0.65) 1.75 4.75 0.050 2.68 (0.68) 1.75 4.50 -0.033 2.34 (0.60) 1.00 3,25 0.143 2.01 (0.58) 1.00 3.00 0.088
(-0.311,0.041) (-0.312,0.051) (-0.473,-0.048) (-0.0378,0.052)
(-0.142,0.242) (-0.221,0.154) (-0.114,0.401) (-0.259,0.434)
0.125 0.149 0.018 0.130
0.592 0.709 0.252 0.603
Group 3: Moderately rough neck
Group 4: Minimally rough neck
Paired difference
Mean (SD)
Min
Max
Mean (SD)
Min
Max
Mean dif
95% CI
P
p < 0.05 indicates a statistically significant difference
Oral Health-Related Quality of Life
(paired t-test).
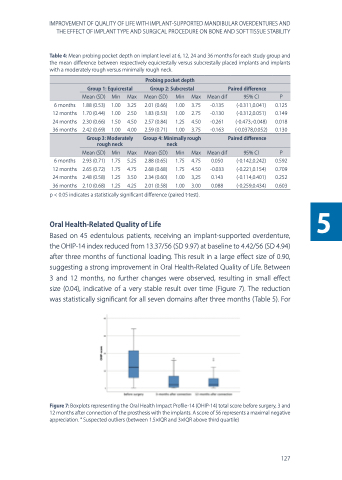
Based on 45 edentulous patients, receiving an implant-supported overdenture, the OHIP-14 index reduced from 13.37/56 (SD 9.97) at baseline to 4.42/56 (SD 4.94) after three months of functional loading. This result in a large effect size of 0.90, suggesting a strong improvement in Oral Health-Related Quality of Life. Between 3 and 12 months, no further changes were observed, resulting in small effect size (0.04), indicative of a very stable result over time (Figure 7). The reduction was statistically significant for all seven domains after three months (Table 5). For
Figure 7: Boxplots representing the Oral Health Impact Profile-14 (OHIP-14) total score before surgery, 3 and 12 months after connection of the prosthesis with the implants. A score of 56 represents a maximal negative appreciation. ° Suspected outliers (between 1.5×IQR and 3×IQR above third quartile)
127
5
