
Page 128 - Peri-implant health: the effect of implant design and surgical procedure on bone and soft tissue stability
P. 128
CHAPTER 5
Biologic Parameters
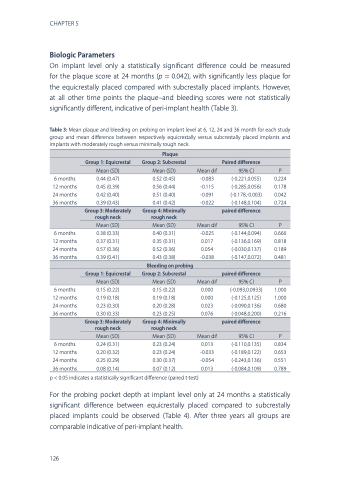
On implant level only a statistically significant difference could be measured for the plaque score at 24 months (p = 0.042), with significantly less plaque for the equicrestally placed compared with subcrestally placed implants. However, at all other time points the plaque–and bleeding scores were not statistically significantly different, indicative of peri-implant health (Table 3).
Table 3: Mean plaque and bleeding on probing on implant level at 6, 12, 24 and 36 month for each study group and mean difference between respectively equicrestally versus subcrestally placed implants and implants with moderately rough versus minimally rough neck.
Plaque
Group 1: Equicrestal
Group 2: Subcrestal
Paired difference
Mean (SD)
Mean (SD)
Mean dif
95% CI
P
6 months 12 months 24 months 36 months
6 months 12 months 24 months 36 months
6 months 12 months 24 months 36 months
6 months 12 months 24 months 36 months
0.44 (0.47) 0.45 (0.39) 0.42 (0.40) 0.39 (0.43)
0.38 (0.33) 0.37 (0.31) 0.57 (0.36) 0.39 (0.41)
0.15 (0.22) 0.19 (0.18) 0.23 (0.30) 0.30 (0.33)
0.24 (0.31) 0.20 (0.32) 0.25 (0.29) 0.08 (0.14)
0.52 (0.45) 0.56 (0.44) 0.51 (0.40) 0.41 (0.42)
0.40 (0.31) 0.35 (0.31) 0.52 (0.36) 0.43 (0.38)
0.15 (0.22) 0.19 (0.18) 0.20 (0.28) 0.23 (0.25)
0.23 (0.24) 0.23 (0.24) 0.30 (0.37) 0.07 (0.12)
significant difference (paired t-test)
-0.083 (-0.221,0.055) -0.115 (-0.285,0.056) -0.091 (-0.178,-0.003) -0.022 (-0.148,0.104)
-0.025 (-0.144,0.094) 0.017 (-0.136,0.169) 0.054 (-0.030,0.137) -0.038 (-0.147,0.072)
0.000 (-0.093,0.0933) 0.000 (-0.125,0.125) 0.023 (-0.090,0.136) 0.076 (-0.048,0.200)
0.013 (-0.110,0.135) -0.033 (-0.189,0.122) -0.054 (-0.243,0.136) 0.013 (-0.084,0.109)
0.224 0.178 0.042 0.724
0.666 0.818 0.189 0.481
1.000 1.000 0.680 0.216
0.834 0.653 0.551 0.789
Group 3: Moderately rough neck
Group 4: Minimally rough neck
paired difference
Mean (SD)
Mean (SD)
Mean dif
95% CI
P
Bleeding on probing
Group 1: Equicrestal
Group 2: Subcrestal
paired difference
Mean (SD)
Mean (SD)
Mean dif
95% CI
P
Group 3: Moderately rough neck
Group 4: Minimally rough neck
paired difference
Mean (SD)
Mean (SD)
Mean dif
95% CI
P
p < 0.05 indicates a statistically
For the probing pocket depth at implant level only at 24 months a statistically significant difference between equicrestally placed compared to subcrestally placed implants could be observed (Table 4). After three years all groups are comparable indicative of peri-implant health.
126
