
Page 125 - Peri-implant health: the effect of implant design and surgical procedure on bone and soft tissue stability
P. 125
IMPROVEMENT OF QUALITY OF LIFE WITH IMPLANT-SUPPORTED MANDIBULAR OVERDENTURES AND THE EFFECT OF IMPLANT TYPE AND SURGICAL PROCEDURE ON BONE AND SOFT TISSUE STABILITY
Mean Bone Level Difference
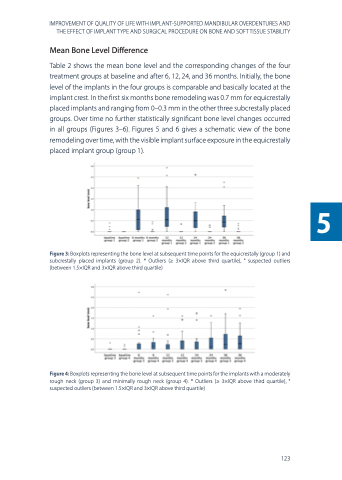
Table 2 shows the mean bone level and the corresponding changes of the four treatment groups at baseline and after 6, 12, 24, and 36 months. Initially, the bone level of the implants in the four groups is comparable and basically located at the implant crest. In the first six months bone remodeling was 0.7 mm for equicrestally placed implants and ranging from 0–0.3 mm in the other three subcrestally placed groups. Over time no further statistically significant bone level changes occurred in all groups (Figures 3–6). Figures 5 and 6 gives a schematic view of the bone remodeling over time, with the visible implant surface exposure in the equicrestally placed implant group (group 1).
Figure 3: Boxplots representing the bone level at subsequent time points for the equicrestally (group 1) and subcrestally placed implants (group 2). * Outliers (≥ 3×IQR above third quartile), ° suspected outliers (between 1.5×IQR and 3×IQR above third quartile)
Figure 4: Boxplots representing the bone level at subsequent time points for the implants with a moderately rough neck (group 3) and minimally rough neck (group 4). * Outliers (≥ 3×IQR above third quartile), ° suspected outliers (between 1.5×IQR and 3×IQR above third quartile)
123
5
