
Page 60 - Postoperative Intra-Abdominal Adhesions- New insights in prevention and consequences
P. 60
Chapter 3
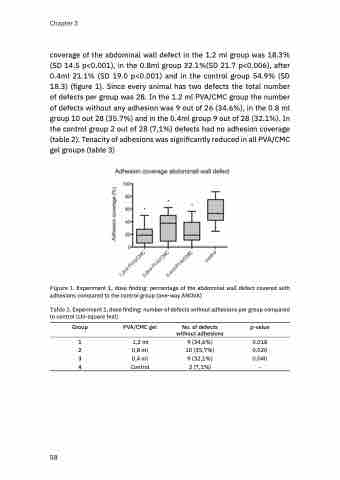
coverage of the abdominal wall defect in the 1.2 ml group was 18.3% (SD 14.5 p<0.001), in the 0.8ml group 32.1%(SD 21.7 p<0.006), after 0.4ml 21.1% (SD 19.0 p<0.001) and in the control group 54.9% (SD 18.3) (figure 1). Since every animal has two defects the total number of defects per group was 28. In the 1.2 ml PVA/CMC group the number of defects without any adhesion was 9 out of 26 (34.6%), in the 0.8 ml group 10 out 28 (35.7%) and in the 0.4ml group 9 out of 28 (32.1%). In the control group 2 out of 28 (7,1%) defects had no adhesion coverage (table 2). Tenacity of adhesions was significantly reduced in all PVA/CMC gel groups (table 3)
Figure 1. Experiment 1, dose finding: percentage of the abdominal wall defect covered with adhesions compared to the control group (one-way ANOVA)
Table 2. Experiment 1, dose finding: number of defects without adhesions per group compared to control (chi-square test)
Group
1 2 3 4
PVA/CMC gel
1,2 ml 0,8 ml 0,4 ml Control
No. of defects without adhesions
9 (34,6%) 10 (35,7%) 9 (32,1%) 2 (7,1%)
p-value
0.018 0.020 0.040 -
58
