
Page 95 - Quantitative Imaging of Small Tumours with Positron Emission Tomography
P. 95
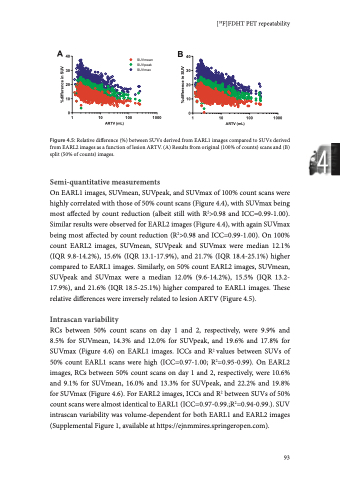
Chapter 4 A 40 30 20 10 0 -10 -20 -30 day 1 day 2 B 40 30 20 +9.8% 10 +8.8% 0 %difference %difference %difference %difference %difference %difference E 40 30 20 10 F 40 30 +19.8% 20 +17.4% 10 +22.5% -400 5 10 15 20 mean SUVmean -30 -400 5 10 15 20 mean SUVmean C40 D40 30 20 10 30 +14.0% 20 +16.5% -10 -20 -30 -12.0% -10 -14.7% -20 -15.5% +12.0% 10 00 +13.2% -13.4% -400 5 10 15 20 mean SUVpeak -30 -400 5 10 15 20 00 -10 -20 -30 -400 5 10 15 20 mean SUVmax -10 -20 -30 +9.4% -8.2% -8.9% -9.9% -10 -20 -10.6% -18.1% -20.2% -19.4% -21.9% Figure 4.6: Bland-Altman graph of intrascan variability due to 50% count reduction for SUVmean (A and B), SUVpeak (C and D), and SUVmax (E and F). Results from both EARL1 images (A, C, E) and EARL2 images (B, D, F) are shown. Variability was derived from the relative difference in SUV between split 1 and 2 of each scan on each day. Note that bw or AUC-PP normalization are not reported separately since normalization factors are identical for split 1 and split 2. Interscan variability For EARL1 images, RCs of 50% count scans were higher than RCs of 100% count scans, but differences in variances were not significant (Figure 4.7 and Table 4.1; ICC 0.94-0.97). A similar effect of count reduction on RCs was observed for selected lesions with ARTV >4.2 mL, but in general RCs for lesions >4.2 mL were lower (Table 4.1). Repeatability of EARL2 was worse than EARL1 at both 100% and 50% count data (Figure 4.7 and Table 4.1). Repeatability of EARL2 images was more affected by count reduction than EARL1 images, yet differences between variances of 100% and 50% count data were not significant (p=0.53-1.00; Table 4.1). Normalizing SUVs to bw (Figure 4.7) resulted in lower RCs than normalizing to AUC-PP (Supplemental Figure 2). 94 mean SUVpeak -400 5 10 15 20 mean SUVmax +10.6% +19.4%
