
Page 93 - Quantitative Imaging of Small Tumours with Positron Emission Tomography
P. 93
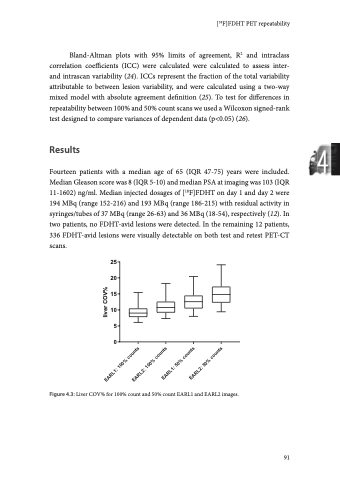
Chapter 4 Image noise Liver COV% of EARL1 images increased from a median 9.0 (IQR 7.9-10.4) to 12.5 (IQR 10.5-14.5) after count reduction (Figure 4.3). For EARL2 images, liver COV% increased from a median 10.8 (IQR 9.2-12.4) to 13.2 (IQR 12.4-17.3) after count reduction. A 25 20 15 10 5 0 C 25 20 15 10 5 0 E 25 20 15 10 5 0 split 1 day 1 split 2 day 1 split 1 day 2 split 2 day 2 B 25 20 15 10 5 0 R2 = 1.00 slope = 0.99-1.01 ICC = 1.00 0 5 10 15 20 25 SUVmean at 100% counts R2 = 0.99-1.00 slope = 0.98-1.00 ICC = 1.00 0 5 10 15 20 25 SUVpeak at 100% counts R2 = 0.98-0.99 slope = 0.97-0.99 ICC = 0.99 0 5 10 15 20 25 SUVmax at 100% counts R2 = 1.00 slope = 0.99-1.01 ICC = 1.00 SUVmax at 50% counts SUVpeak at 50% counts SUVmean at 50% counts SUVmax at 50% counts SUVpeak at 50% counts SUVmean at 50% counts Figure 4.4: Correlations between SUVbw of original 100% count scans and split 50% count scans for SUVmean (A and B), SUVpeak (C and D), and SUVmax (E and F). Results from both EARL1 images (A, C, E) and EARL2 images (B, D, F) are shown. 92 D 25 20 15 10 5 0 F 25 20 15 10 5 0 0 5 10 15 20 25 SUVmean at 100% counts R2 = 0.99 slope = 0.98-1.00 ICC = 1.00 0 5 10 15 20 25 SUVpeak at 100% counts R2 = 0.98-0.99 slope = 0.97-0.99 ICC = 0.99 0 5 10 15 20 25 SUVmax at 100% counts
