
Page 58 - Quantitative Imaging of Small Tumours with Positron Emission Tomography
P. 58
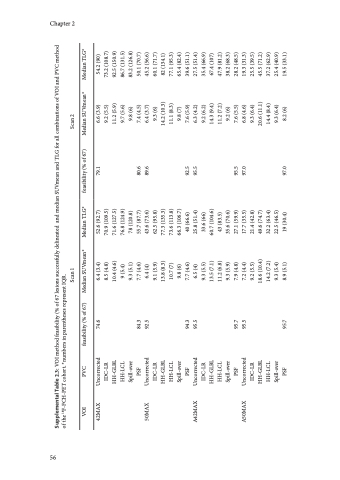
Accuracy and Precision of PVC 2 57 A50PEAK Uncorrected 94.0 IDC-LR HH-GLBL HH-LCL Spill-over 6 (3.8) 8.4 (5.1) 11.3 (6.3) 9.7 (5.4) 8.8 (5.3) 7.2 (4.7) 7.4 (4.2) 9.6 (5.1) 21.9 (10.9) 14.9 (8.6) 10.3 (5.8) 8.9 (5.1) 6.1 (3.5) 8.4 (5) 11.1 (7.4) 11.3 (6.4) 9.4 (5.1) 7.3 (4.5) 35.4 (61.4) 94.0 47.9 (83.6) 68 (116.5) 59.7 (92.9) 5.9 (3.8) 8.3 (5.3) 12.7 (6) 9.6 (6.3) 8.8 (5.5) 7.1 (4.6) 7.3 (4.7) 9.3 (5.7) 24.5 (11.1) 14.7 (9.4) 9.5 (6.6) 8.5 (5.4) 35.5 (58.7) 48 (76.7) 73.3 (110.2) 60.1 (85.2) 52.2 (80.7) 33 (60) 14.4 (26.5) 19.8 (35.8) 41.2 (62.9) 32.3 (58.9) 19.9 (37.4) 17.4 (28.5) 44.8 (64.2) 60.9 (81.1) 79.1 (110.4) 79.6 (110.4) 70.4 (93.2) 45.3 (62.6) PSF 95.7 A70PEAK Uncorrected 97.0 52.3 (85.1) 41.6 (69.9) 95.5 Non-PSF 0.98 (0.97-0.99) 0.96 0.92 (0.93-0.97) (0.87-0.95) 0.96 0.94 (0.94-0.98) (0.90-0.96) 0.95 0.96 (0.92-0.97) (0.94-0.98) PSF 0.97 (0.94-0.98) 0.95 0.95 (0.92-0.97) (0.91-0.97) 0.97 0.88 (0.95-0.98) (0.81-0.93) 0.89 0.93 (0.82-0.93) (0.88-0.95) IDC-LR HH-GLBL HH-LCL Spill-over 15.1 (26) 98.5 20 (33.8) PSF 97.1 RTL Uncorrected 91.0 5.4 (30.8) 98.5 43.6 (67.4) 94.0 58.1 (84.7) 6 (3.6) 8.3 (5.4) 12 (7.8) 11 (7.5) 9.5 (5.9) 7.1 (5) IDC-LR HH-GLBL HH-LCL Spill-over 74.4 (123.3) 72.7 (127.9) 68.3 (94) PSF 94.3 Supplemental Table 2.4: ICCs of VOI volumes generated on non-PSF- and PSF-reconstructed images in the 18F-FDG-PET cohort. 95%-CI in parentheses. 42MAX 50MAX A42MAX A50MAX A50PEAK A70PEAK RTL 47 (75) 33.4 (51.6) 20.9 (34.6) 46.3 (73.9) 95.5
