
Page 57 - Quantitative Imaging of Small Tumours with Positron Emission Tomography
P. 57
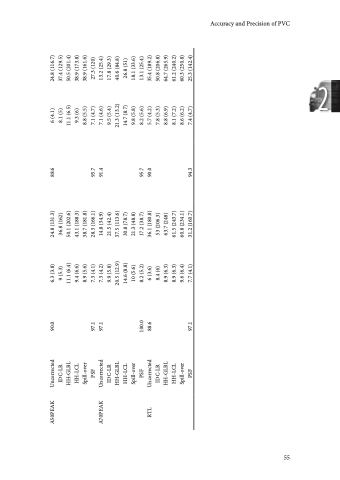
Chapter 2 56 Supplemental Table 2.3: VOI method feasibility (% of 67 lesions successfully delineated and median SUVmean and TLG for all combinations of VOI and PVC method of the 18F-FCH-PET cohort. *numbers in parentheses represent IQR. VOI PVC feasibility (% of 67) 74.6 Scan 1 Median SUVmean* Median TLG* feasibility (% of 67) 79.1 Scan 2 Median SUVmean* Median TLG* 42MAX Uncorrected IDC-LR 6.4 (3.4) 52.6 (92.7) 70.9 (109.5) 71.6 (127.5) 76.8 (124.9) 78 (120.8) 55.7 (87.7) 43.6 (73.6) 62.5 (95.8) 77.3 (135.3) 73.6 (113.8) 66.3 (106.7) 40 (66.6) 25.8 (51.4) 33.6 (66) 60.7 (104.6) 43 (83.5) 35.6 (70.6) 27.1 (59.9) 17.7 (35.5) 21.4 (42.8) 49.6 (74.7) 32.2 (63.4) 22.5 (46.5) 19 (30.4) 6.6 (3.9) 54.2 (90) 73.2 (108.7) 92.5 (150.9) 86.7 (131.5) 83.2 (126.8) 50.1 (70.7) 45.2 (56.6) 60.1 (71.7) 82 (134.1) 77.1 (95.3) 65.4 (82.4) 39.6 (51.1) 27.5 (51.4) 35.4 (66.9) 67.4 (107) 47.9 (81.2) 38.2 (68.3) 28.2 (48.5) 19.3 (31.3) 25.5 (39.5) 45.5 (71.2) 37.2 (62.9) 25.4 (40.9) 19.5 (33.1) 50MAX Uncorrected IDC-LR A42MAX Uncorrected IDC-LR A50MAX Uncorrected IDC-LR HH-GLBL HH-LCL Spill-over PSF 84.3 92.5 8.5 (4.8) 10.4 (4.6) 9 (5.4) 9.3 (5.1) 7.7 (4.6) 6.4 (4) 9.1 (5.9) 13.8 (8.3) 10.7 (7) 9.8 (6) 7.7 (4.6) 6.5 (4) 9.3 (5.5) 13.5 (7.1) 11.2 (6.8) 9.3 (5.9) 7.9 (4.8) 7.2 (4.4) 9.2 (5.5) 18.6 (10.4) 14.2 (7.2) 9.3 (5.4) 8.9 (5.1) 80.6 89.6 9.2 (5.5) 11.2 (5.9) 9.7 (5.6) 9.8 (6) 7.4 (4.5) 6.4 (3.7) 9.3 (6) 14.2 (10.3) 11.1 (8.3) 9.8 (7) 7.6 (5.9) 6.3 (4.2) 9.2 (6.2) 14.3 (9.4) 11.2 (7.2) 9.2 (6) 7.6 (5.5) 6.8 (4.6) 9.3 (6.4) 20.6 (11.1) 14.4 (8.4) 9.3 (6.4) 8.2 (6) HH-GLBL HH-LCL Spill-over PSF 94.3 95.5 92.5 95.5 HH-GLBL HH-LCL Spill-over PSF 95.7 95.5 95.5 97.0 HH-GLBL HH-LCL Spill-over PSF 95.7 97.0
