
Page 157 - Quantitative Imaging of Small Tumours with Positron Emission Tomography
P. 157
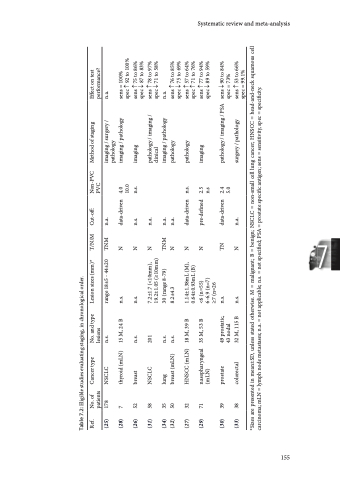
Chapter 7 Table 7.3: Eligible studies evaluating prognostication, in chronological order. Ref. No. of patients (35) 145 (37) 52 (38) 50 (36) 191 (39) 19 (40) 19 Cancer type NSCLC esophageal esophageal NSCLC HNC HNC No. of lesions n.s. n.s. n.s. n.s. 19 19 Spectrum of tumor sizes (mm)* median 30 (range 10-110) n.s. 39.9±36.1mL median 23 (range 10-36) 15.2±5.0 15±5 Effect on prognostication? not improved not improved not improved not improved improved improved for subgroup *Sizes are presented in mean±SD, unless stated otherwise. NSCLC = non-small cell lung cancer; mLN = lymph node metastases; HNC = head-and-neck cancer; n.s. = not specified. Table 7.4: Eligible studies evaluating response assessment, in chronological order. Ref. No. of Cancer patients type (41) 35 LABC (42) 51 breast (43) 28 LARC (44) 40 mCRC (45) 19 NSCLC No. of lesions n.s. n.s. n.s. 101 24 Spectrum of tumor sizes (mL)* n.s. median 14 (range 2-227) median 23 (range 2-397) 34.4±66.4 median 6.95 (range 2.2-46) Reference test clinical + pathologic pathologic pathologic RECIST clinical Effect on response assessment? not improved not improved not improved worsened PERCIST classification improved in 5 lesions, confirmed in follow-up *Sizes are presented in mean±SD, unless stated otherwise, at baseline. LABC = locally-advanced breast cancer; LARC = locally-advanced rectal cancer; NSCLC = non-small cell lung cancer; mCRC = metastatic colorectal cancer; n.s. = not specified. Diagnosis Impact of PVC on diagnosis (Table 7.1, n=10) was investigated for pulmonary nodules (n=6), breast lesions (n=1), and lymphoma (n=3). PVC included recovery coefficient-method (n=9) and CT-volume-based PVC (n=1). All studies reported lesion sizes. One study stratified both uncorrected and PVC data for lesion size in secondary analysis. The six studies evaluating diagnostic accuracy of PET for pulmonary nodules were pooled (Table 7.1, Figure 7.3-7.4), including a total of 352 malignant and 327 benign lesions (15-20). Prevalence of malignancy ranged from 27-77% (mean 57%). Five studies applied an RC-method for PVC, one study applied a CT-volume-based correction. Thresholds of PET positivity were predefined in 5/6 studies and data-driven in 1/6 studies. Predefined thresholds were similar for uncorrected and PVC data. Three studies used SUV 2.5 as predefined threshold (16,17,20). One study used SUV 2.0 and 2.5 as thresholds (19). One study used SUV 1.5, 2.0, 2.5, and 3.0 as thresholds (15). In case of multiple predefined thresholds, 156
