
Page 137 - 18F-FDG PET as biomarker in aggressive lymphoma; technical and clinical validation
P. 137
PET improves DLBCL response predictors
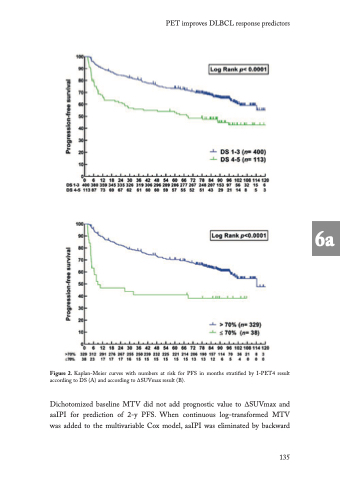
Figure 2. Kaplan-Meier curves with numbers at risk for PFS in months stratified by I-PET4 result according to DS (A) and according to ∆SUVmax result (B).
Dichotomized baseline MTV did not add prognostic value to ∆SUVmax and aaIPI for prediction of 2-y PFS. When continuous log-transformed MTV was added to the multivariable Cox model, aaIPI was eliminated by backward
135
6a
