
Page 135 - 18F-FDG PET as biomarker in aggressive lymphoma; technical and clinical validation
P. 135
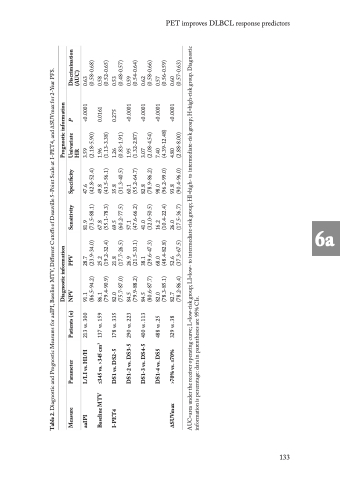
                                PET improves DLBCL response predictors
     Table 2. Diagnostic and Prognostic Measures for aaIPI, Baseline MTV, Different Cutoffs of Deauville 5-Point Scale at I-PET4, and ∆SUVmax for 2-Year PFS.
Discrimination (0.56-0.59) (0.57-0.63) (0.58-0.66) (0.54-0.64) (0.48-0.57) (0.52-0.65) (0.58-0.68) (AUC) 0.60 0.57 0.62 0.59 0.53 0.58 0.63
group. Diagnostic
AUC=area under the receiver operating curve; L=low-risk group; LI=low- to intermediate-risk group; HI=high- to intermediate-risk group; H=high-risk information is percentage: data in parentheses are 95% CIs.
   <0.0001 <0.0001 <0.0001 <0.0001 <0.0001 0.275 0.0161 P Prognostic information Univariate HR (17.5-36.7) (90.4-96.0) (2.88-8.00) (10.4-22.4) (96.2-99.0) (4.39-12.48) (32.0-50.5) (78.9-86.2) (2.08-4.54) (47.6-66.2) (55.2-64.7) (1.32-2.87) (60.2-77.5) (31.3-40.5) (0.83-1.91) (55.1-78.3) (43.5-56.1) (1.13-3.38) (73.5-88.1) (42.8-52.4) (2.18-5.90) 26.0 93.8 4.80 16.2 98.0 7.40 41.0 82.8 3.07 57.1 60.1 1.95 69.5 35.8 1.26 67.8 49.8 1.96 81.9 47.6 3.59
        Specificity
   Sensitivity
       Diagnostic information NPV PPV
(86.5-94.2) (23.9-34.0) (79.4-90.9) (19.2-32.4) (75.7-87.0) (17.7-26.5) (79.9-88.2) (21.5-33.1) (80.6-87.7) (29.6-47.3) (78.3-85.1) (48.4-82.8) (78.2-86.4) (37.3-67.5) 82.7 52.6 400 vs. 113 84.5 38.1 290 vs. 223 84.5 26.9 178 vs. 335 82.0 21.8 137 vs. 159 86.1 25.2 213 vs. 300 91.1 28.7 488 vs. 25 82.0 68.0 329 vs. 38
        Patients (n)
     Parameter
L/LI vs. HI/H
3
≤345 vs. >345 cm
DS1 vs. DS2-5
DS1-2 vs. DS3-5 DS1-3 vs. DS4-5
DS1-4 vs. DS5
>70% vs. ≤70%
∆SUVmax
     Measure
Baseline MTV
aaIPI
I-PET4
 133
 6a
