
Page 129 - Molecular features of low-grade developmental brain tumours
P. 129
DYSREGULATION OF MMP/TIMP IN SEGA: MODULATION BY MIR-320D IN VITRO
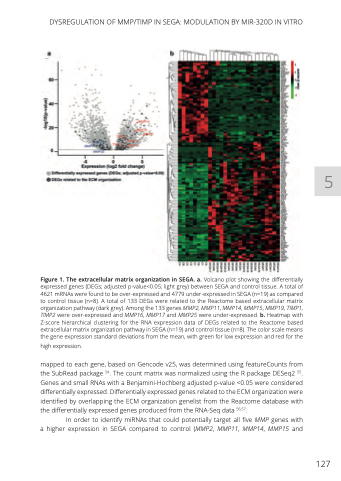
Figure 1. The extracellular matrix organization in SEGA. a. Volcano plot showing the differentially expressed genes (DEGs; adjusted p-value<0.05; light grey) between SEGA and control tissue. A total of 4621 mRNAs were found to be over-expressed and 4779 under-expressed in SEGA (n=19) as compared to control tissue (n=8). A total of 133 DEGs were related to the Reactome based extracellular matrix organization pathway (dark grey). Among the 133 genes MMP2, MMP11, MMP14, MMP15, MMP19, TIMP1, TIMP2 were over-expressed and MMP16, MMP17 and MMP25 were under-expressed. b. Heatmap with Z-score hierarchical clustering for the RNA expression data of DEGs related to the Reactome based extracellular matrix organization pathway in SEGA (n=19) and control tissue (n=8). The color scale means the gene expression standard deviations from the mean, with green for low expression and red for the
high expression.
mapped to each gene, based on Gencode v25, was determined using featureCounts from the SubRead package 54. The count matrix was normalized using the R package DESeq2 55. Genes and small RNAs with a Benjamini-Hochberg adjusted p-value <0.05 were considered differentially expressed. Differentially expressed genes related to the ECM organization were identified by overlapping the ECM organization genelist from the Reactome database with the differentially expressed genes produced from the RNA-Seq data 56,57.
In order to identify miRNAs that could potentially target all five MMP genes with a higher expression in SEGA compared to control (MMP2, MMP11, MMP14, MMP15 and
127
5
