
Page 84 - Coronary hemodynamics in acute myocardial infarction - Matthijs Bax
P. 84
Chapter 5
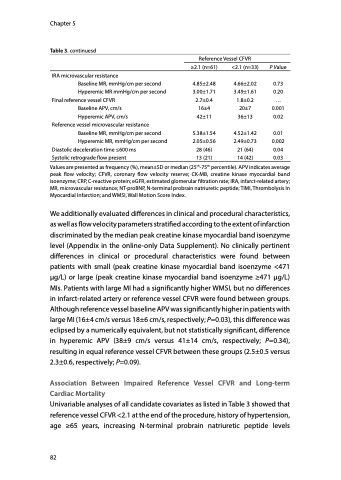
Table 3. continuesd
IRA microvascular resistance
Baseline MR, mmHg/cm per second
Hyperemic MR mmHg/cm per second Final reference vessel CFVR
Baseline APV, cm/s
Hyperemic APV, cm/s Reference vessel microvascular resistance
Baseline MR, mmHg/cm per second
Hyperemic MR, mmHg/cm per second Diastolic deceleration time ≤600 ms
Systolic retrograde flow present
Reference Vessel CFVR
≥2.1 (n=61)
4.85±2.48 3.00±1.71 2.7±0.4 16±4 42±11
5.38±1.54 2.05±0.56 28 (46) 13 (21)
<2.1 (n=33)
4.66±2.02 3.49±1.61 1.8±0.2 20±7 36±13
4.52±1.42 2.49±0.73 21 (64) 14 (42)
P Value
0.73 0.20 ... 0.001 0.02
0.01 0.002 0.04 0.03
Values are presented as frequency (%), mean±SD or median (25th-75th percentile). APV indicates average peak flow velocity; CFVR, coronary flow velocity reserve; CK-MB, creatine kinase myocardial band isoenzyme; CRP, C-reactive protein; eGFR, estimated glomerular filtration rate; IRA, infarct-related artery; MR, microvascular resistance; NT-proBNP, N-terminal probrain natriuretic peptide; TIMI, Thrombolysis In Myocardial Infarction; and WMSI, Wall Motion Score Index.
We additionally evaluated differences in clinical and procedural characteristics, as well as flow velocity parameters stratified according to the extent of infarction discriminated by the median peak creatine kinase myocardial band isoenzyme level (Appendix in the online-only Data Supplement). No clinically pertinent differences in clinical or procedural characteristics were found between patients with small (peak creatine kinase myocardial band isoenzyme <471 μg/L) or large (peak creatine kinase myocardial band isoenzyme ≥471 μg/L) MIs. Patients with large MI had a significantly higher WMSI, but no differences in infarct-related artery or reference vessel CFVR were found between groups. Although reference vessel baseline APV was significantly higher in patients with large MI (16±4 cm/s versus 18±6 cm/s, respectively; P=0.03), this difference was eclipsed by a numerically equivalent, but not statistically significant, difference in hyperemic APV (38±9 cm/s versus 41±14 cm/s, respectively; P=0.34), resulting in equal reference vessel CFVR between these groups (2.5±0.5 versus 2.3±0.6, respectively; P=0.09).
Association Between Impaired Reference Vessel CFVR and Long-term Cardiac Mortality
Univariable analyses of all candidate covariates as listed in Table 3 showed that reference vessel CFVR <2.1 at the end of the procedure, history of hypertension, age ≥65 years, increasing N-terminal probrain natriuretic peptide levels
82
