
Page 37 - Coronary hemodynamics in acute myocardial infarction - Matthijs Bax
P. 37
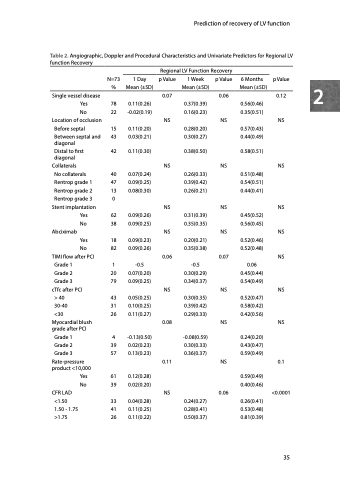
Table 2. Angiographic, Doppler and Procedural Characteristics and Univariate Predictors for Regional LV function Recovery
Prediction of recovery of LV function
 Regional LV Function Recovery
 N=73 1 Day
% Mean (±SD)
p Value
0.07 NS
NS
NS
NS 0.06
NS
0.08
0.11
NS
1 Week Mean (±SD)
0.37(0.39) 0.16(0.23)
0.28(0.20) 0.30(0.27)
0.38(0.50)
0.26(0.33) 0.39(0.42) 0.26(0.21)
0.31(0.39) 0.35(0.35)
0.20(0.21) 0.35(0.38)
-0.5 0.30(0.29) 0.34(0.37)
0.30(0.35) 0.39(0.42) 0.29(0.33)
-0.08(0.59) 0.30(0.33) 0.36(0.37)
0.24(0.27) 0.28(0.41) 0.50(0.37)
p Value
0.06 NS
NS
NS
NS 0.07
NS
NS
NS
0.06
6 Months Mean (±SD)
0.56(0.46) 0.35(0.51)
0.57(0.43) 0.44(0.49)
0.58(0.51)
0.51(0.48) 0.54(0.51) 0.44(0.41)
0.45(0.52) 0.56(0.45)
0.52(0.46) 0.52(0.48)
0.06 0.45(0.44) 0.54(0.49)
0.52(0.47) 0.58(0.42) 0.42(0.56)
0.24(0.20) 0.43(0.47) 0.59(0.49)
0.59(0.49) 0.40(0.46)
0.26(0.41) 0.53(0.48) 0.81(0.39)
p Value
2
   Single vessel disease
Yes 78
No 22 Location of occlusion
Before septal 15
Between septal and 43 diagonal
Distal to first 42 diagonal
Collaterals
No collaterals 40 Rentrop grade 1 47 Rentrop grade 2 13 Rentrop grade 3 0
Stent implantation
Yes 62
No 38 Abciximab
Yes 18
No 82 TIMI flow after PCI
Grade 1 1 Grade 2 20 Grade 3 79
cTfc after PCI
> 40 43 30-40 31 <30 26
Myocardial blush grade after PCI
Grade 1 4 Grade 2 39 Grade 3 57
Rate-pressure product <10,000
0.11(0.26) -0.02(0.19)
0.11(0.20) 0.03(0.21)
0.11(0.30)
0.07(0.24) 0.09(0.25) 0.08(0.30)
0.09(0.26) 0.09(0.25)
0.09(0.23) 0.09(0.26)
-0.5 0.07(0.20) 0.09(0.25)
0.05(0.25) 0.10(0.25) 0.11(0.27)
-0.13(0.50) 0.02(0.23) 0.13(0.23)
0.12(0.28) 0.02(0.20)
0.12 NS
NS
NS NS NS
NS
NS
0.1
<0.0001
CFR LAD <1.50 1.50 - 1.75 >1.75
33 0.04(0.28) 41 0.11(0.25) 26 0.11(0.22)
Yes 61 No 39
35
