
Page 35 - Coronary hemodynamics in acute myocardial infarction - Matthijs Bax
P. 35
vessel 29 ± 12. A significant association existed between TIMI flow grade and
cTfc (r = -0.72, p < 0.0001), TIMI flow grade and myocardial blush grade (r =
0.45, p < 0.0001), and cTfc and myocardial blush grade (r = -0.53, p < 0.0001).
At the end of the PCI procedure, mean CFR in the LAD coronary artery was 2 1.62 ± 0.37 (range, 1.0 to 2.6), with a mean baseline APV of 20.1 ± 8.5 cm/s and
a mean hyperemic APV of 32.0 ± 14.1 cm/s. The mean reference vessel CFR was 2.43 ± 0.53. In the LAD coronary artery, mean diastolic deceleration time was 635 ± 382 ms, mean average systolic flow velocity 9.9 ± 8.4 cm/s, mean diastolic-to-systolic flow velocity 4.2 ± 6.2, and mean early systolic retrograde flow velocity 6.3 ± 11 cm/s. Baseline APV in the LAD coronary artery showed fair correlations with TIMI flow grade (r = 0.31, p < 0.007) and cTfc (r = -0.54, p < 0.0001). No association was found between baseline APV and myocardial blush grade. A fair correlation existed between baseline APV and ST-segment resolution (r = -0.40, p < 0.003). Hyperemic APV in the LAD coronary artery was associated with TIMI flow grade (r = 0.35, p < 0.003), cTfc (r = -0.50, p < 0.0001), myocardial blush grade (r = 0.25, p = 0.04), and with ST-segment resolution (r = 0.29, p = 0.04). There was no significant correlation between CFR and any of the angiographic parameters or between CFR and ST-segment resolution. Mean peak CK-MB was 486 ± 255 μg/l.
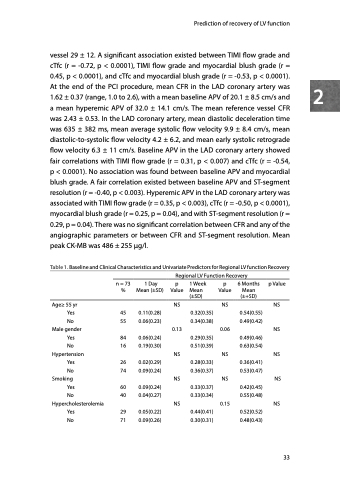
Table 1. Baseline and Clinical Characteristics and Univariate Predictors for Regional LV function Recovery
Prediction of recovery of LV function
Regional LV Function Recovery
n
= 73 %
45 55
84 16
26 74
60 40
29 71
1 Day Mean (±SD)
0.11(0.28) 0.06(0.23)
0.06(0.24) 0.19(0.30)
0.02(0.29) 0.09(0.24)
0.09(0.24) 0.04(0.27)
0.05(0.22) 0.09(0.26)
p Value
NS 0.13 NS NS NS
1 Week Mean (±SD)
0.32(0.35) 0.34(0.38)
0.29(0.35) 0.51(0.39)
0.28(0.33) 0.36(0.37)
0.33(0.37) 0.33(0.34)
0.44(0.41) 0.30(0.31)
p Value
NS 0.06 NS NS 0.15
6 Months Mean (±+SD)
0.54(0.55) 0.49(0.42)
0.49(0.46) 0.63(0.54)
0.36(0.41) 0.53(0.47)
0.42(0.45) 0.55(0.48)
0.52(0.52) 0.48(0.43)
p Value
NS NS NS
NS NS
Age≥ 55 yr Yes
No Male gender
Yes
No Hypertension
Yes
No Smoking
Yes
No Hypercholesterolemia
Yes No
33
