
Page 83 - Demo
P. 83
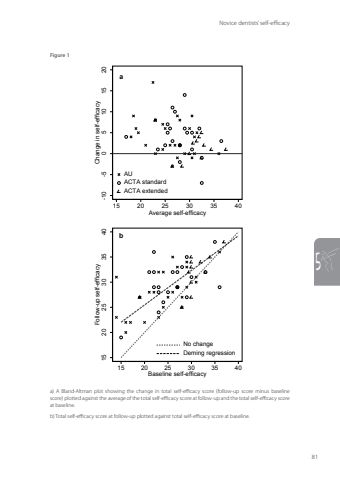
Novice dentists’ self-efficacy815Figure 1a-10 -5 0 5 10 15 20Change in self-efficacy15 20 25 30 35 40Average self-efficacyAUACTA standardACTA extendedb15 20 25 30 35 40Follow-up self-efficacy15 20 25 30 35 40Baseline self-efficacyNo changeDeming regressiona) A Bland-Altman plot showing the change in total self-efficacy score (follow-up score minus baseline score) plotted against the average of the total self-efficacy score at follow-up and the total self-efficacy score at baseline. b) Total self-efficacy score at follow-up plotted against total self-efficacy score at baseline.Annemarie Baaij.indd 81 28-06-2023 12:26
