
Page 119 - Physical activity in recipients of solid organ transplantation - Edwin J. van Adrichem
P. 119
Physical activity in recipients of solid organ transplantation
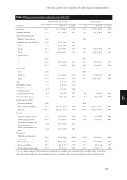
Table 4.
Regression models sedentary time (
n
=527)
Variable
Intercept
β
Model with all variables
Final model
394.6 <.001
12.6 -21.7; 46.9 .470 Ref.
37.2 -12.5; 97.6 .133 -42.3 -119.5; 46.1 .287
Ref.
-21.2 -59.1; 16.5 .271
46.5 -6.0; 98.7 .081 Ref.
24.7 -15.6; 65.0 .229 57.6 14.1; 101.7 .010
0.2 -0.4; 0.8 .441 -3.1 -5.8; -0.4 .025
Ref.
-68.2 -111.7; -27.5 .001
-101.0 -147.2; -58.7 <.001 53.2 4.2; 99.0 .026
56.0 25.4; 87.3 <.001
52.2 18.6; 86.1 .002 -13.8 -45.0; 18.6 .393
-21.0 -47.2; 4.4 .109
95% CI
p-
value
β
95% CI
p-
value
390.0 13.2
<.001 -21.7; 48.1 .457
-33.0; 58.8 .582 -43.2; 54.8 .815 -12.5; 99.8 .127
-120.0; 47.5 .395 -59.6; 16.5 .267
-7.2; 98.5 .090 -13.0; 69.8 .179
16.9; 107.1 .007 -1.5; 2.3 .687 -2.6; 4.7 .578
-0.5; 0.3 .529 -0.3; 0.8 .427
-6.0; -0.4 .023 -117.0; -27.4 .002
-168.6; -53.7 <.001 3.6; 10.3.0 .036
25.0; 88.3 <.001 -62.3; 49.6 .824
-40.1; 39.7 .992 16.2; 86.8 .004
-46.3; 18.1 .390 -46.8; 5.9 .128
333.2; 446.9
335.7; 444.8
Gender (female)
Type transplantation
Kidney, living donor
Kidney, deceased donor
Liver 5.8 Lung 43.6 Heart -36.2
Comorbidities
0 Ref. 1-2 -21.6 ≥3 45.7
Education
Low Ref.
Ref. 12.9
Medium
Time since
Exercise self-e cacy
Employment status Actively working Not actively working Retired
Barriers
Lack of motivation or
time Motivators
Health and physical
outcomes
External in uences
28.4 62.0 0.4 1.0
-0.1
0.2 -3.2
Ref. -72.2 -111.2
53.3 56.7
-6.4 -0.2
51.5
-14.1 -20.5
High
Age
Body Mass Index
transplantation
Length hospital stay
Fear of negative e
ects
Physical limitations
Low expectations and
self-con
dence
Group activities
Psychological outcomes
CI, con
-26.7
-54.8; 1.4
dence interval. All continuous explanatory variables are centered at the median value. A positive
.062
-26.5
-54.2; 1.3
.060
slope parameter indicates more sedentary time, a negative slope parameter indicates less sedentary time.
117.
6
