
Page 118 - Physical activity in recipients of solid organ transplantation - Edwin J. van Adrichem
P. 118
Chapter 6
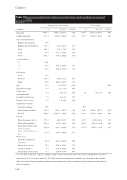
Table 3.
activity,
Regression models level of physical activity (min./week moderate to vigorous
n
=595)
Variable
Intercept
β
Model with all variables
Final model
-524.2; -247.3
95% CI
p-
value
β
p-
value
1792.4 -373.4
Type transplantation
Kidney, living donor Ref. Kidney, deceased donor -135.3 Liver -161.3 Lung -29.4 Heart -181.2
Comorbidities
0 Ref. 1-2 -18.6 ≥3 -96.9
Education
Low Ref. Medium -128.1
<.001 -524.9; -221.9 <.001
-331.7; 61.1 .177
-373.3; 50.7 .136 -279.5; 220.8 .818 -555.2; 192.9 .342
-186.2; 149.0 .827 -326.5; 132.7 .408
-307.3; 51.1 .161 -262.5; 128.7 .502 25.6; 42.1 <.001 -22.5; 9.9 .443
-0.0; 3.4 .055 -1.6; 3.6 .437
1322.8 -385.7
<.001 <.001
1574.7; 2037.1
95% CI
1170.0; 1475.5
Gender (female)
High
Age
Body Mass Index
Time since
-66.9 33.8 -6.3
1.7
*
1.1
*
-0.5; 2.7
-761.1; -417.5 -919.8; -340.9
-272.7; 67.6 -328.4; -88.9
-447.6; -28.0
<.001
.164
<.001 <.001
.238 .001
.027
transplantation
1.0 Exercise self-e cacy 4.9
Employment status
Actively working Ref. Not actively working -558.2 Retired -809.0
-7.1; 16.8 .426
Ref.
Length hospital stay
Barriers
Lack of motivation or
time Motivators
Health and physical
outcomes
External in uences 19.9
-5.0
-752.7; -363.7 <.001 -1085.0; -560.0 <.001
-368.1; 21.5 .081 -338.5; -64.2 .004
-365.3; 106.6 .282 -196.5; 149.0 .787
-163.7; 141.4 .886 -116.4; 156.3 .774
-118.6; 108.6 .931
-589.3 -630.3
-102.5 -208.7
-237.8
-173.3 -201.4
-129.4 -23.8
Fear of negative e
ects
Physical limitations
Low expectations and
self-con
dence
-11.2
Group activities
Psychological outcomes
CI, con
dence interval, *
12.3
Age as a spline is signi
-110.4; 134.9
.845
cant in the model, this non-linear contribution cannot be
expressed in a β coe cient and 95% CI. All continuous explanatory variables are centered at the median value. A positive slope parameter indicates more physical activity, a negative slope parameter indicates less
physical activity.
116.
