
Page 59 - Like me, or else... - Michelle Achterberg
P. 59
Social evaluation in childhood
57
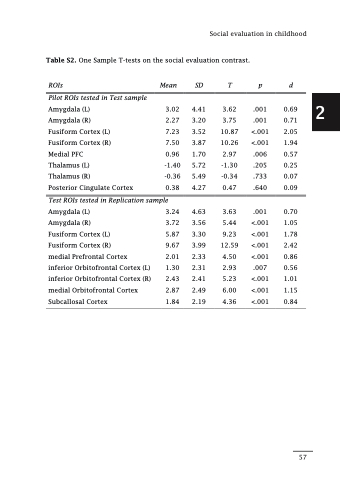
Table S2. One Sample T-tests on the social evaluation contrast.
ROIs
Pilot ROIs tested in Test sample
Amygdala (L)
Amygdala (R)
Fusiform Cortex (L) Fusiform Cortex (R) Medial PFC
Thalamus (L)
Thalamus (R)
Posterior Cingulate Cortex
Mean SD
3.02 4.41 2.27 3.20 7.23 3.52 7.50 3.87 0.96 1.70 -1.40 5.72 -0.36 5.49 0.38 4.27
T p d
3.62 .001 0.69
3.75 .001 0.71 10.87 <.001 2.05 10.26 <.001 1.94
2.97 .006 0.57 -1.30 .205 0.25 -0.34 .733 0.07 0.47 .640 0.09
3.63 .001 0.70 5.44 <.001 1.05 9.23 <.001 1.78
12.59 <.001 2.42 4.50 <.001 0.86 2.93 .007 0.56 5.23 <.001 1.01 6.00 <.001 1.15 4.36 <.001 0.84
Test ROIs tested in Replication sample
Amygdala (L)
Amygdala (R)
Fusiform Cortex (L)
Fusiform Cortex (R)
medial Prefrontal Cortex inferior Orbitofrontal Cortex (L) inferior Orbitofrontal Cortex (R) medial Orbitofrontal Cortex Subcallosal Cortex
3.24 4.63 3.72 3.56 5.87 3.30 9.67 3.99 2.01 2.33 1.30 2.31 2.43 2.41 2.87 2.49 1.84 2.19
2
