
Page 57 - Like me, or else... - Michelle Achterberg
P. 57
Social evaluation in childhood
55
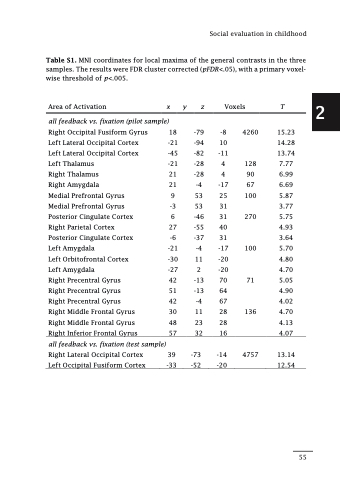
Table S1. MNI coordinates for local maxima of the general contrasts in the three samples. The results were FDR cluster corrected (pFDR<.05), with a primary voxel- wise threshold of p<.005.
Area of Activation x
all feedback vs. fixation (pilot sample)
y z
Voxels T
Right Occipital Fusiform Gyrus Left Lateral Occipital Cortex Left Lateral Occipital Cortex Left Thalamus
Right Thalamus
Right Amygdala
Medial Prefrontal Gyrus Medial Prefrontal Gyrus Posterior Cingulate Cortex Right Parietal Cortex Posterior Cingulate Cortex Left Amygdala
Left Orbitofrontal Cortex Left Amygdala
Right Precentral Gyrus Right Precentral Gyrus Right Precentral Gyrus Right Middle Frontal Gyrus Right Middle Frontal Gyrus Right Inferior Frontal Gyrus
all feedback vs. fixation (test sample)
Right Lateral Occipital Cortex Left Occipital Fusiform Cortex
18 -21 -45 -21 21 21 9 -3 6 27 -6 -21 -30 -27 42 51 42 30 48 57
39 -33
-79 -8 -94 10 -82 -11 -28 4 -28 4
-4 -17 53 25 53 31 -46 31 -55 40 -37 31
-4 -17 11 -20 2 -20
-13 70 -13 64 -4 67 11 28 23 28 32 16
-73 -14 -52 -20
4260
15.23 14.28 13.74
128 7.77 90 6.99 67 6.69
100 5.87 3.77 270 5.75 4.93 3.64 100 5.70 4.80 4.70 71 5.05 4.90 4.02 136 4.70 4.13 4.07
4757
13.14 12.54
2
