
Page 206 - Like me, or else... - Michelle Achterberg
P. 206
Chapter 7
‘Doubtful’ (all p’s<.02). Therefore, for analyses using more lenient quality control, we included data that were classified as ‘Excellent’, ‘Good’ and ‘Doubtful’.
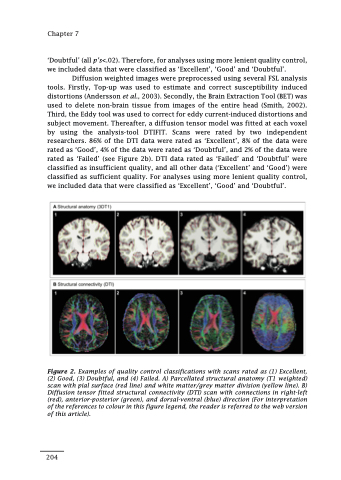
Diffusion weighted images were preprocessed using several FSL analysis tools. Firstly, Top-up was used to estimate and correct susceptibility induced distortions (Andersson et al., 2003). Secondly, the Brain Extraction Tool (BET) was used to delete non-brain tissue from images of the entire head (Smith, 2002). Third, the Eddy tool was used to correct for eddy current-induced distortions and subject movement. Thereafter, a diffusion tensor model was fitted at each voxel by using the analysis-tool DTIFIT. Scans were rated by two independent researchers. 86% of the DTI data were rated as ‘Excellent’, 8% of the data were rated as ‘Good’, 4% of the data were rated as ‘Doubtful’, and 2% of the data were rated as ‘Failed’ (see Figure 2b). DTI data rated as ‘Failed’ and ‘Doubtful’ were classified as insufficient quality, and all other data (‘Excellent’ and ‘Good’) were classified as sufficient quality. For analyses using more lenient quality control, we included data that were classified as ‘Excellent’, ‘Good’ and ‘Doubtful’.
Figure 2. Examples of quality control classifications with scans rated as (1) Excellent, (2) Good, (3) Doubtful, and (4) Failed. A) Parcellated structural anatomy (T1 weighted) scan with pial surface (red line) and white matter/grey matter division (yellow line). B) Diffusion tensor fitted structural connectivity (DTI) scan with connections in right-left (red), anterior-posterior (green), and dorsal-ventral (blue) direction (For interpretation of the references to colour in this figure legend, the reader is referred to the web version of this article).
204
