
Page 129 - Like me, or else... - Michelle Achterberg
P. 129
Longitudinal changes of brain and behavior
127
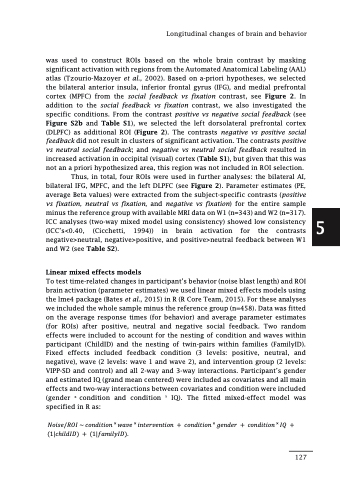
was used to construct ROIs based on the whole brain contrast by masking significant activation with regions from the Automated Anatomical Labeling (AAL) atlas (Tzourio-Mazoyer et al., 2002). Based on a-priori hypotheses, we selected the bilateral anterior insula, inferior frontal gyrus (IFG), and medial prefrontal cortex (MPFC) from the social feedback vs fixation contrast, see Figure 2. In addition to the social feedback vs fixation contrast, we also investigated the specific conditions. From the contrast positive vs negative social feedback (see Figure S2b and Table S1), we selected the left dorsolateral prefrontal cortex (DLPFC) as additional ROI (Figure 2). The contrasts negative vs positive social feedback did not result in clusters of significant activation. The contrasts positive vs neutral social feedback; and negative vs neutral social feedback resulted in increased activation in occipital (visual) cortex (Table S1), but given that this was not an a priori hypothesized area, this region was not included in ROI selection.
Thus, in total, four ROIs were used in further analyses: the bilateral AI, bilateral IFG, MPFC, and the left DLPFC (see Figure 2). Parameter estimates (PE, average Beta values) were extracted from the subject-specific contrasts (positive vs fixation, neutral vs fixation, and negative vs fixation) for the entire sample minus the reference group with available MRI data on W1 (n=343) and W2 (n=317). ICC analyses (two-way mixed model using consistency) showed low consistency (ICC’s<0.40, (Cicchetti, 1994)) in brain activation for the contrasts negative>neutral, negative>positive, and positive>neutral feedback between W1 and W2 (see Table S2).
Linear mixed effects models
To test time-related changes in participant’s behavior (noise blast length) and ROI brain activation (parameter estimates) we used linear mixed effects models using the lme4 package (Bates et al., 2015) in R (R Core Team, 2015). For these analyses we included the whole sample minus the reference group (n=458). Data was fitted on the average response times (for behavior) and average parameter estimates (for ROIs) after positive, neutral and negative social feedback. Two random effects were included to account for the nesting of condition and waves within participant (ChildID) and the nesting of twin-pairs within families (FamilyID). Fixed effects included feedback condition (3 levels: positive, neutral, and negative), wave (2 levels: wave 1 and wave 2), and intervention group (2 levels: VIPP-SD and control) and all 2-way and 3-way interactions. Participant’s gender and estimated IQ (grand mean centered) were included as covariates and all main effects and two-way interactions between covariates and condition were included (gender х condition and condition x IQ). The fitted mixed-effect model was specified in R as:
!"#$%/'() ~ ,"-.#/#"- ˟ 123% ˟ #-/%43%-/#"- + ,"-.#/#"- ˟ 6%-.%4 + ,"-.#/#"- ˟ )7 + (1|,h#<.)=) + (1|?2@#<A)=).
5
