
Page 62 - The role of advanced echocardiography in patients with ischemic heart disease - Rachid Abou
P. 62
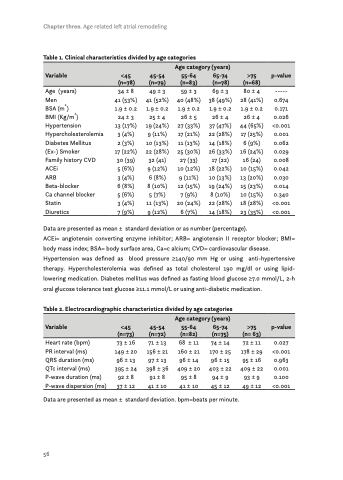
Chapter three. Age related left atrial remodeling
Table 1. Clinical characteristics divided by age categories
  Age category (years)
Variable
 <45 (n=78)
 45-54 (n=79)
 55-64 (n=83)
 65-74 (n=78)
 >75 (n=68)
 p-value
  Age (years)
Men
BSA (m2)
BMI (Kg/m2) Hypertension Hypercholesterolemia Diabetes Mellitus (Ex-) Smoker
Family history CVD ACEi
ARB
Beta-blocker
Ca channel blocker Statin
Diuretics
34 ± 8 41 (53%) 1.9 ± 0.2 24 ± 3 13 (17%) 3 (4%) 2 (3%) 17 (22%) 30 (39) 5 (6%) 3 (4%) 6 (8%) 5 (6%) 3 (4%) 7 (9%)
49 ± 3 41 (52%) 1.9 ± 0.2 25 ± 4 19 (24%) 9 (11%) 10 (13%) 22 (28%) 32 (41) 9 (12%) 6 (8%) 8 (10%) 5 (7%) 11 (13%) 9 (12%)
59 ± 3 40 (48%) 1.9 ± 0.2 26 ± 5 27 (33%) 17 (21%) 11 (13%) 25 (30%) 27 (33) 10 (12%) 9 (11%) 12 (15%) 7 (9%) 20 (24%) 6 (7%)
69 ± 3 38 (49%) 1.9 ± 0.2 26 ± 4 37 (47%) 22 (28%) 14 (18%) 26 (33%) 17 (22) 18 (22%) 10 (13%) 19 (24%) 8 (10%) 22 (28%) 14 (18%)
80 ± 4 28 (41%) 1.9 ± 0.2 26 ± 4 44 (65%) 17 (25%) 6 (9%) 16 (24%) 16 (24) 10 (15%) 13 (20%) 15 (23%) 10 (15%) 18 (28%) 23 (35%)
----- 0.674 0.171 0.026 <0.001 0.001 0.062 0.029 0.008 0.042 0.030 0.014 0.340 <0.001 <0.001
 Data are presented as mean ± standard deviation or as number (percentage).
ACEi= angiotensin converting enzyme inhibitor; ARB= angiotensin II receptor blocker; BMI= body mass index; BSA= body surface area, Ca=c alcium; CVD= cardiovascular disease. Hypertension was defined as blood pressure ≥140/90 mm Hg or using anti-hypertensive therapy. Hypercholesterolemia was defined as total cholesterol 190 mg/dl or using lipid- lowering medication. Diabetes mellitus was defined as fasting blood glucose ≥7.0 mmol/L, 2-h oral glucose tolerance test glucose ≥11.1 mmol/L or using anti-diabetic medication.
Table 2. Electrocardiographic characteristics divided by age categories
  Age category (years)
Variable
 <45 (n=73)
 45-54 (n=72)
 55-64 (n=82)
 65-74 (n=75)
 >75 (n= 63)
 p-value
  Heart rate (bpm)
PR interval (ms)
QRS duration (ms)
QTc interval (ms) P-wave duration (ms) P-wave dispersion (ms)
73 ± 16 149 ± 20 96 ± 13 395 ± 24 92 ± 8 37 ± 12
71 ± 13 156 ± 21 97 ± 13 398 ± 36 91 ± 8 41 ± 10
68 ± 11 160 ± 21 96 ± 14 409 ± 20 95 ± 8 41 ± 10
74 ± 14 170 ± 25 96 ± 15 403 ± 22 94 ± 9 45 ± 12
72 ± 11 178 ± 29 95 ± 16 409 ± 22 93 ± 9 49 ± 12
0.027 <0.001 0.963 0.001 0.100 <0.001
 Data are presented as mean ± standard deviation. bpm=beats per minute.
56
