
Page 42 - The role of advanced echocardiography in patients with ischemic heart disease - Rachid Abou
P. 42
Chapter two. Level and Layer Specific Left Ventricular Longitudinal Strain
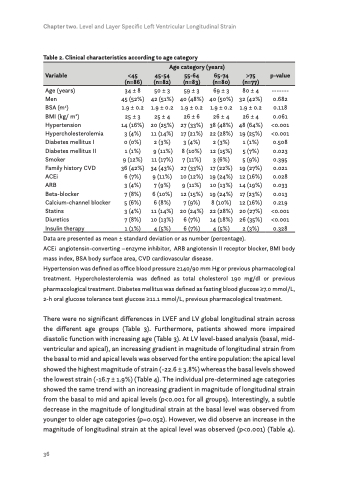
Table 2. Clinical characteristics according to age category
Age category (years)
Variable
<45 (n=86)
45-54 (n=82)
55-64 (n=83)
65-74 (n=80)
>75 (n=77)
p-value
Age (years)
Men
BSA (m2)
BMI (kg/ m2) Hypertension Hypercholesterolemia Diabetes mellitus I Diabetes mellitus II Smoker
Family history CVD
ACEi
ARB
Beta-blocker Calcium-channel blocker Statins
Diuretics Insulin therapy
34 ± 8 45 (52%) 1.9 ± 0.2 25 ± 3 14 (16%) 3 (4%) 0 (0%) 1 (1%) 9 (12%) 36 (42%) 6 (7%) 3 (4%) 7 (8%) 5 (6%) 3 (4%) 7 (8%) 1 (1%)
50 ± 3 42 (51%) 1.9 ± 0.2 25 ± 4 20 (25%) 11 (14%) 2 (3%)
9 (11%) 11 (17%) 34 (43%) 9 (11%) 7 (9%) 6 (10%) 6 (8%) 11 (14%) 10 (13%) 4 (5%)
59 ± 3 40 (48%) 1.9 ± 0.2 26 ± 6 27 (33%) 17 (21%) 3 (4%) 8 (10%) 7 (11%) 27 (33%) 10 (12%) 9 (11%) 12 (15%) 7 (9%) 20 (24%) 6 (7%) 6 (7%)
69 ± 3 40 (50%) 1.9 ± 0.2 26 ± 4 38 (48%) 22 (28%) 2 (3%) 12 (15%) 3 (6%) 17 (22%) 19 (24%) 10 (13%) 19 (24%) 8 (10%) 22 (28%) 14 (18%) 4 (5%)
------- 0.682 0.118 0.061
Data are presented as mean ± standard deviation
ACEi angiotensin-converting –enzyme inhibitor, ARB angiotensin II receptor blocker, BMI body mass index, BSA body surface area, CVD cardiovascular disease.
Hypertension was defined as office blood pressure ≥140/90 mm Hg or previous pharmacological treatment. Hypercholesterolemia was defined as total cholesterol 190 mg/dl or previous pharmacological treatment. Diabetes mellitus was defined as fasting blood glucose ≥7.0 mmol/L, 2-h oral glucose tolerance test glucose ≥11.1 mmol/L, previous pharmacological treatment.
There were no significant differences in LVEF and LV global longitudinal strain across the different age groups (Table 3). Furthermore, patients showed more impaired diastolic function with increasing age (Table 3). At LV level-based analysis (basal, mid- ventricular and apical), an increasing gradient in magnitude of longitudinal strain from the basal to mid and apical levels was observed for the entire population: the apical level showed the highest magnitude of strain (-22.6 ± 3.8%) whereas the basal levels showed the lowest strain (-16.7 ± 1.9%) (Table 4). The individual pre-determined age categories showed the same trend with an increasing gradient in magnitude of longitudinal strain from the basal to mid and apical levels (p<0.001 for all groups). Interestingly, a subtle decrease in the magnitude of longitudinal strain at the basal level was observed from younger to older age categories (p=0.052). However, we did observe an increase in the magnitude of longitudinal strain at the apical level was observed (p<0.001) (Table 4).
36
or as number (percentage).
80 ± 4
32 (42%)
1.9 ± 0.2
26 ± 4
48 (64%) <0.001
19 (25%) 1 (1%) 5 (7%) 5 (9%) 19 (27%) 12 (16%) 14 (19%) 17 (23%) 12 (16%) 20 (27%) 26 (35%) 2 (3%)
<0.001 0.508 0.023 0.395 0.021 0.028 0.033 0.013 0.219 <0.001 <0.001 0.328
