
Page 39 - The role of advanced echocardiography in patients with ischemic heart disease - Rachid Abou
P. 39
longitudinal strain of 17 segments at each layer (Figure 3). The mid-myocardial strain is the average of the epi- and endocardial layers.
Continuous variables are reported as mean ± standard deviation for normally distributed 2 variables and were analysed using one-way analysis of variance (ANOVA). Categorical
variables are reported as frequencies and percentages and were analysed using the χ2
test. Comparison of LV longitudinal strain of the 3 myocardial levels (basal, mid-ventricular
and apical) and the 3 myocardial layers (endocardial, mid-myocardial and epicardial) across age categories was performed using a linear mixed model for hierarchical data. The age category was incorporated into the model as fixed variable as well as the interaction between age and LV longitudinal strain. A diagonal covariance matrix was applied for repeated effects. The estimated marginal means and standard deviation
data are presented. Pairwise comparisons were performed to assess differences between
of numerical data are presented. Pairwise comparisons were performed to assess
age categories. Univariate and multivariable analysis was performed to examine the effect of
differences between age categories. Univariate and multivariable analysis was performed
age on layer-specific longitudinal systolic strain, adjusted for known confounders such as
to examine the effect of age on layer-specific longitudinal systolic strain, adjusted for
traditional risk factors and cardiovascular medications. Level of significance for
known confounders such as traditional risk factors and cardiovascular medications. Level
univariate analysis was set at p<0.20. The intra-class coefficient (ICC) was calculated to
of significance for univariate analysis was set at p<0.20. The intra-class coefficient (ICC)
assess the inter- and intra-observer variability for global longitudinal strain. Twenty random
was calculated to assess the inter- and intra-observer variability for global longitudinal
selected patients were analysed by two separate readers. An excellent agreement was sdtreafin.edTwaseInCtCy>r0a.n7d5owmhesrelaescstterdonpgaatgierenetsmewnetrdeefaineadlyassedICCby0.6tw0-o0.7s4e.pSatraattiseticraelaadnearlsy.siAs n
was performed on SPSS for Windows v20.0 (IBM, Armonk, New York). A 2-tailed p-value of
excellent agreement was defined as ICC > 0.75 whereas strong agreement defined as
<0.05 was considered statistically significant.
ICC 0.60-0.74. Statistical analysis was performed on SPSS for Windows v20.0 (IBM, Armonk, New York). A 2-tailed p-value of <0.05 was considered statistically significant.
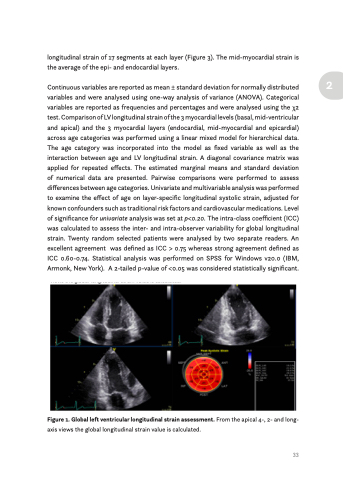
Figure 1. Global left ventricular longitudinal strain assessment. From the apical 4-, 2- and long-axis views the global longitudinal strain value is calculated.
Figure 1. Global left ventricular longitudinal strain assessment. From the apical 4-, 2- and long- axis views the global longitudinal strain value is calculated.
33
