
Page 139 - The role of advanced echocardiography in patients with ischemic heart disease - Rachid Abou
P. 139
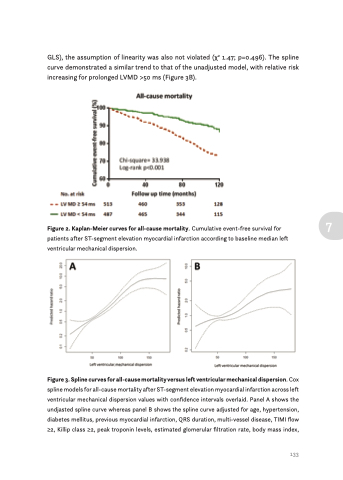
GLS), the assumption of linearity was also not violated (χ2 1.47; p=0.496). The spline curve demonstrated a similar trend to that of the unadjusted model, with relative risk increasing for prolonged LVMD >50 ms (Figure 3B).
Figure 2. Kaplan-Meier curves for all-cause mortality. Cumulative event-free survival for 7 patients after ST-segment elevation myocardial infarction according to baseline median left
ventricular mechanical dispersion.
Figure 3. Spline curves for all-cause mortality versus left ventricular mechanical dispersion. Cox spline models for all-cause mortality after ST-segment elevation myocardial infarction across left ventricular mechanical dispersion values with confidence intervals overlaid. Panel A shows the undjasted spline curve whereas panel B shows the spline curve adjusted for age, hypertension, diabetes mellitus, previous myocardial infarction, QRS duration, multi-vessel disease, TIMI flow ≥2, Killip class ≥2, peak troponin levels, estimated glomerular filtration rate, body mass index,
   133
