
Page 136 - The role of advanced echocardiography in patients with ischemic heart disease - Rachid Abou
P. 136
Chapter seven. LVMD in STEMI and prognosis
blood glucose ≥7.0 mmol/L, 2-h oral glucose tolerance test glucose ≥11.1 mmol/L or previous pharmacological treatment. p-values are presented for the comparisons between different groups.
Correlates of prolonged left ventricular mechanical dispersion
Univariable clinical correlates of prolonged LVMD included older age, higher systolic blood pressure, hypertension, current smoker, diabetes mellitus, prolonged QRS duration, heart failure Killip class ≥2, higher peak troponin levels, lower heart rate at discharge, left anterior descending (LAD) coronary artery as culprit vessel, TIMI flow <2, worse renal function and lesser use ACEi/ARBs and β-blockers (Table 3). Furthermore, lower LVEF, higher WMSI, larger indexed LV mass and worse LV GLS were all significant univariable echocardiographic correlates of LVMD. On multivariable analysis, increasing age, systolic blood pressure, diabetes mellitus, LAD as culprit vessel, TIMI flow ≥ 2, lesser use of ACEi/ARBs, higher heart rate and worse LV GLS were independently associated with prolonged LVMD after STEMI (Table 3).
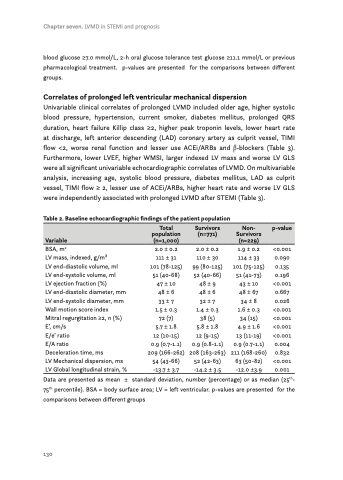
Table 2. Baseline echocardiographic findings of the patient population
Variable
Total population (n=1,000)
Survivors (n=771)
Non- Survivors (n=229)
p-value
BSA, m2
LV mass, indexed, g/m2
LV end-diastolic volume, ml
LV end-systolic volume, ml
LV ejection fraction (%)
LV end-diastolic diameter, mm LV end-systolic diameter, mm Wall motion score index
Mitral regurgitation ≥2, n (%) E’, cm/s
E/e’ ratio
E/A ratio
Deceleration time, ms
LV Mechanical dispersion, ms LV Global longitudinal strain, %
2.0 ± 0.2 111 ± 31 101 (78-125) 51 (40-68) 47 ± 10
48 ± 6
33 ± 7
1.5 ± 0.3 72 (7)
5.7 ± 1.8
12 (10-15) 0.9 (0.7-1.1) 209 (166-262) 54 (43-66) -13.7 ± 3.7
2.0 ± 0.2
110 ± 30 99 (80-125) 52 (40-66) 48 ± 9
48 ± 6
32 ± 7
1.4 ± 0.3 38 (5)
5.8 ± 1.8 12 (9-15) 0.9 (0.8-1.1) 208 (163-263) 52 (42-63) -14.2 ± 3.5
1.9 ± 0.2
114 ± 33 101 (75-125) 51 (41-73) 43 ± 10 48 ± 67
34 ± 8
1.6 ± 0.3 34 (15) 4.9 ± 1.6 13 (11-19) 0.9 (0.7-1.1) 211 (168-260) 63 (50-82) -12.0 ±3.9
<0.001 0.090 0.135 0.196 <0.001 0.667 0.026 <0.001 <0.001 <0.001 <0.001 0.004 0.832 <0.001 0.001
Data are presented as mean ± standard deviation, number (percentage) or as median (25th- 75th percentile). BSA = body surface area; LV = left ventricular. p-values are presented for the comparisons between different groups
130
