
Page 133 - The role of advanced echocardiography in patients with ischemic heart disease - Rachid Abou
P. 133
cardiology information system, which is linked with the governmental death registry database.
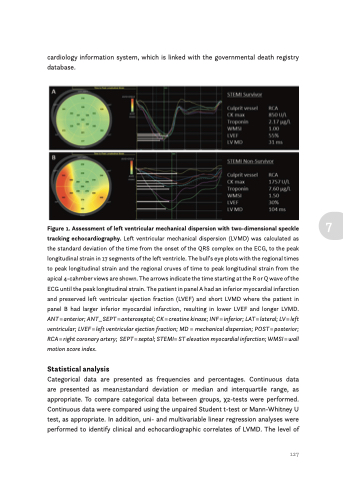
Figure 1. Assessment of left ventricular mechanical dispersion with two-dimensional speckle 7 tracking echocardiography. Left ventricular mechanical dispersion (LVMD) was calculated as
the standard deviation of the time from the onset of the QRS complex on the ECG, to the peak
longitudinal strain in 17 segments of the left ventricle. The bull’s eye plots with the regional times
to peak longitudinal strain and the regional cruves of time to peak longitudinal strain from the apical 4-cahmber views are shown. The arrows indicate the time starting at the R or Q wave of the ECG until the peak longitudinal strain. The patient in panel A had an inferior myocardial infarction and preserved left ventricular ejection fraction (LVEF) and short LVMD where the patient in panel B had larger inferior myocardial infarction, resulting in lower LVEF and longer LVMD. ANT = anterior; ANT_SEPT = anteroseptal; CK = creatine kinase; INF = inferior; LAT = lateral; LV = left ventricular; LVEF = left ventricular ejection fraction; MD = mechanical dispersion; POST = posterior; RCA=rightcoronaryartery; SEPT=septal;STEMI=STelevationmyocardialinfarction;WMSI=wall motion score index.
Statistical analysis
Categorical data are presented as frequencies and percentages. Continuous data are presented as mean±standard deviation or median and interquartile range, as appropriate. To compare categorical data between groups, χ2-tests were performed. Continuous data were compared using the unpaired Student t-test or Mann-Whitney U test, as appropriate. In addition, uni- and multivariable linear regression analyses were performed to identify clinical and echocardiographic correlates of LVMD. The level of
127
